


This page is the home of my all Google Sheets Charts related tutorials. I hope this can help you to easily navigate to the relevant Chart tutorial pages.
Charts are used for representing data graphically and it’s built into Google Sheets. You can use different charts in Google Sheets.
To plot graphs in Google Sheets or any other spreadsheet application you should know two basic things.
1. Find the suitable charts for the data in hand.
2. Formatting of data for the chart – This information I have included in the relevant chart tutorials below.
If you can conquer this, creating graphs in Google Sheets is pretty easy.
Built-in Charts in Google Sheets
Here is a growing list of chart tutorials. I will include more chart tips as and when ready.
Relationship / Distribution
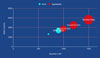
1. Bubble Chart
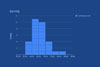
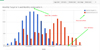
3. Histogram
Hierarchical Relationship
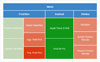
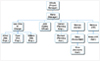
Org. Chart is part of every successful business establishments. This tutorial covers the steps to create an Org chart in Google Sheets to show the hierarchical relationship between employees.
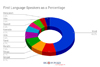
Composition
2. Pie Chart
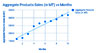
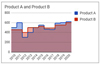
3. Area Chart
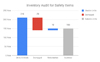
Comparison
1. Column Chart
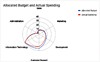
2. Radar Chart
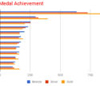
3. Bar Chart
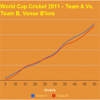
4. Line Chart
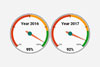
5. Gauge Chart

Other Google Sheets Graphs
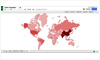
1. Geo Chart and Geo Chart with Markers
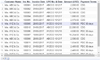
2. Table Chart

Dynamic Graphs in Google Sheets
How to Get Dynamic Range in Charts in Google Sheets.
Custom Charts in Google Sheets
Create Gantt Chart Online Using Google Sheets
You can create Gantt Chart Online using Google Sheets. There is no built-in Gantt Chart template. You can use the function Sparkline, or custom formula in conditional formatting to create an online Gantt Chart using Google Sheets.
See the available Gantt Chart options in Google Sheets.
- Sparkline Formula for Gantt Chart.
- Gantt Chart Using Premium Wrike Project Management Tool.
- Gantt Chart Using Conditional Formatting and Custom Formulas.
- Create a Gantt Chart in Google Sheets Using Stacked Bar Chart.
Miscellaneous Charts in Google Sheets
- Sparkline Charts Using Formula – Bar, Column, Line, and Winloss.
- How to Create S Curve in Google Sheets.
Related Reading:
Hi Prashanth,
I have a Google sheet that takes data from a Google Form, and the data are not numbers but answers like Yes or No. Can that be represented with a chart as well?
Hi, Paul,
Yes, but we may require to manipulate the data to make it suitable for the chart.