Tree mapping is a way to visualize hierarchical data using nested rectangles. It’s similar to an organizational chart but gives you control over the size of the boxes based on your data. If you understand a few data formatting techniques, creating a Tree Map Chart in Google Sheets becomes simple and intuitive.
Once you go through the two examples below, I’m confident you’ll master the techniques of data formatting and creating Tree Map Charts for your data in Google Sheets.
If you’d like to follow along with me, you can copy my sample sheet by clicking the button below:
Creating a Tree Map Chart (Parent and Children)
Data Formatting
In the following Tree Map Chart, there’s one parent and multiple children.
Let’s take a hospital example where the data shows the current waiting time for new bookings in each department based on consultation time required.
Here’s how the data is structured:
| A | B | C | |
| 1 | Clinical Departments | 7:40:00 | |
| 2 | General Medicine | Clinical Departments | 1:00:00 |
| 3 | General Surgery | Clinical Departments | 0:25:00 |
| 4 | Obstetrics & Gynaecology | Clinical Departments | 0:10:00 |
| 5 | Paediatrics | Clinical Departments | 1:00:00 |
| 6 | Dermatology | Clinical Departments | 0:10:00 |
| 7 | ENT | Clinical Departments | 0:30:00 |
| 8 | Cancer & Radiotherapy | Clinical Departments | 1:00:00 |
| 9 | Ophthalmology | Clinical Departments | 0:10:00 |
| 10 | Psychiatry | Clinical Departments | 0:30:00 |
| 11 | Chest Diseases | Clinical Departments | 0:30:00 |
| 12 | Anaesthesiology | Clinical Departments | 0:45:00 |
| 13 | Physiotherapy | Clinical Departments | 0:55:00 |
| 14 | Plastic Surgery | Clinical Departments | 0:35:00 |
Explanation of Columns:
- Column A: The parent is “Clinical Departments,” and the children are the individual departments, from “General Medicine” to “Plastic Surgery.”
- Column B: Enter the parent name (“Clinical Departments”) against each child.
- Column C: Enter the consultation time required for each child. For the parent, in cell C1, calculate the total time using the formula:
=SUM(C2:C)
Creating the Tree Map Chart
Here’s how to create the Tree Map Chart:
- Select the range A1:C14.
- Go to the menu Insert > Chart.
- In the Chart Editor, under the “Chart type” dropdown, select Tree Map Chart.
That’s it! Your Tree Map Chart is ready, showing two levels: one Parent and multiple Children.

Creating a Tree Map Chart (Parent → Children → Grandchildren)
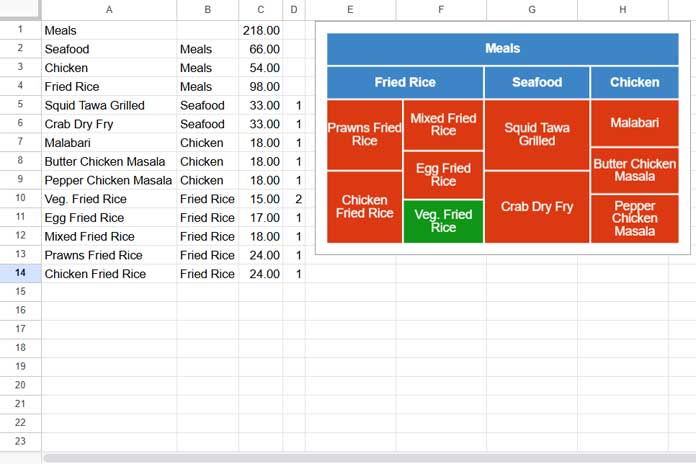
In this example, we’ll use a hotel menu to visualize the price of food items.
Here’s the sample data:
| A | B | C | |
| 1 | Meals | 218.00 | |
| 2 | Seafood | Meals | 66.00 |
| 3 | Chicken | Meals | 54.00 |
| 4 | Fried Rice | Meals | 98.00 |
| 5 | Squid Tawa Grilled | Seafood | 33.00 |
| 6 | Crab Dry Fry | Seafood | 33.00 |
| 7 | Malabari | Chicken | 18.00 |
| 8 | Butter Chicken Masala | Chicken | 18.00 |
| 9 | Pepper Chicken Masala | Chicken | 18.00 |
| 10 | Veg. Fried Rice | Fried Rice | 15.00 |
| 11 | Egg Fried Rice | Fried Rice | 17.00 |
| 12 | Mixed Fried Rice | Fried Rice | 18.00 |
| 13 | Prawns Fried Rice | Fried Rice | 24.00 |
| 14 | Chicken Fried Rice | Fried Rice | 24.00 |
Explanation of Columns:
- Column A: List the Grandparent (Meals), Parents (Seafood, Chicken, and Fried Rice), and Grandchildren (food items from “Squid Tawa Grilled” to “Chicken Fried Rice”).
- Column B: Assign the immediate parent to each child and grandchild. For example, Seafood, Chicken, and Fried Rice are assigned to “Meals,” while food items are assigned to their respective parent categories.
- Column C: Enter the price for each food item, starting from “Squid Tawa Grilled” to “Chicken Fried Rice.” For parent categories (Seafood, Chicken, and Fried Rice) and the Grandparent (Meals), calculate the total size using SUMIF formulas as follows:
SUMIF Formulas:
- For the Grandparent (“Meals”) in C1:
=SUMIF(B2:B, "Meals", C2:C) - For “Seafood” in C2:
=SUMIF(B3:B, "Seafood", C3:C) - For “Chicken” in C3:
=SUMIF(B4:B, "Chicken", C4:C) - For “Fried Rice” in C4:
=SUMIF(B5:B, "Fried Rice", C5:C)
Once the data is ready, you can use it to create a Tree Map Chart in Google Sheets as described in the earlier example. This chart will show hierarchical relationships from Meals to the individual food items.

Customizing the Tree Map Chart
- Controlling Colors:
Add a fourth column to control the color of the rectangles (Grandchildren). For example, enter1for non-veg items and2for veg items. Google Sheets will use this to differentiate the colors.
- Setting Collapsible Levels:
By default, all levels will appear in the chart. Under Chart Editor > Customize > Tree Map, you can select the level to display. For example, set it to Level 1 to show only the Grandparent and Children. Click on a Child to drill down into the Grandchildren.

- Hinted Levels:
To indicate that the Tree Map has more levels, use the “Hinted Levels” option under the same menu. Enter1to show an indicator for expandable levels.
Tips and Tricks:
- Use abbreviated words in Columns A and B for better readability.
- Resize the chart by dragging the blue square around the chart to fit your data.
- Add titles, background colors, or border colors using the Customize tab in the Chart Editor.
- Use the Header Color and Min/Max Color options to make the chart visually appealing.
That’s all! With these steps, you can easily create and customize Tree Map Charts in Google Sheets for any dataset. Let me know in the comments if you have questions or need more examples.


Thank you for the article. Do you know how we could format the chart to get:
https://stackoverflow.com/questions/51078336/formatting-google-charts-treemap-node
By default, the Treemap is created with one level. If you think your chart needs two levels, but there’s a problem with your data, then CUSTOMISE is ghosted out and you can’t change the level. I keep getting error’s with ‘found two entries with the same label’.