You can create Gantt Chart online using web-based and feature-packed Wrike Project Management Software. Needless to say, Gantt Chart is the best option to visualize a project schedule.
Earlier I’ve shared the tips to create a Gantt chart using Google Sheets formulas. It was an ordinary-looking Gantt Chart with no/limited customization. Also, I’ve shared the tip to use the Stacked Bar chart as a basic Gantt Chart.
That time I think I had promised you about writing a tutorial on how to create a professional-looking Gantt Chart using the popular Wrike Online Project Management Software.
Wrike is a very popular all-in-one project management software. It’s pretty easy to use and feature-packed. If you’re using Google sheets to plan your work, consider checking out
Wrike, the dedicated project management software.
Wrike Project Management Software is a paid application but they offer a free trial. I was very curious to test their interface because I had some exposure to offline project management software products like MS Project and Primavera. But that was a couple of years back and I’ve almost forgotten how to use them by now.
So I decided to test the Wrike software product in a limited way. My goal was to see how to create a Gantt Chart Online using Wrike.
The first hurdle for me to test the Wrike Interface was the lack of a real-life project in hand.
I don’t have any softcopy/hardcopy of any of the projects I had involved in in the past. Even if I’ve, I may not be able to share here.
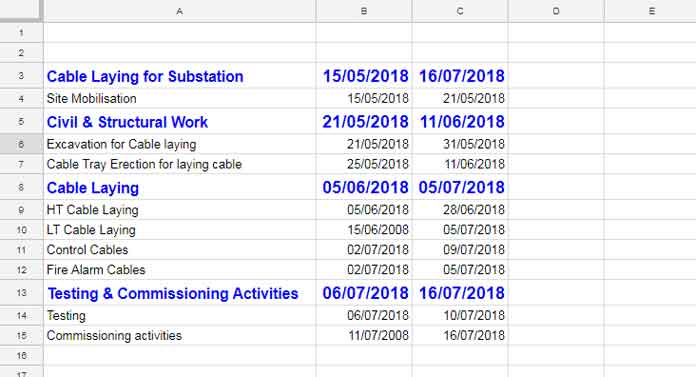
So I’ve just created a sample Google Sheet from the scratch as preparation, to begin with, an online beautiful Gantt Chart in Wrike. Here is that.
How to Create Gantt Chart Using Wrike Online
I am trying to make this tutorial simpler by giving you step-by-step instructions and screenshots.
But you might see a different interface if the Wrike team updates their software interface at any point in time in the future.
But the procedure to create the online Gantt chart may almost the same. Also, the Wrike team provides live chat support.
Let’s begin with the sample data required for the Gantt Chart.
The data, please refer to my above screenshot taken from Google Sheets, is about the cable laying activities for a substation job. The activities in Blue colors are the main tasks and the activities under them are the subtasks.
This sheet is my reference to create the interactive Gantt Chart using the Wrike project management tool. So you can just skip typing that data. You can refer to the screenshot where adding tasks in Wrike.
Steps to Create Gantt Chart in Wrike Project Management Software
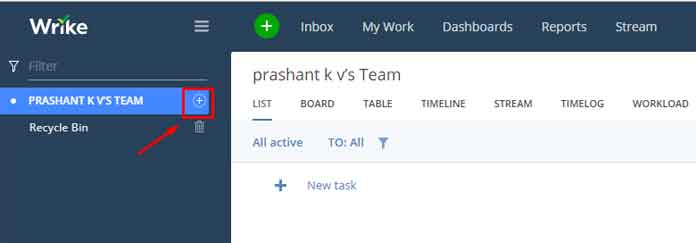
Hope you have already signed into their dashboard. On the home screen click on the “+” button and select “Project”.
Actually, I was clueless about how to create the chart. After some experiments, I found that I should start by clicking the “+” button to create a Gantt Chart.
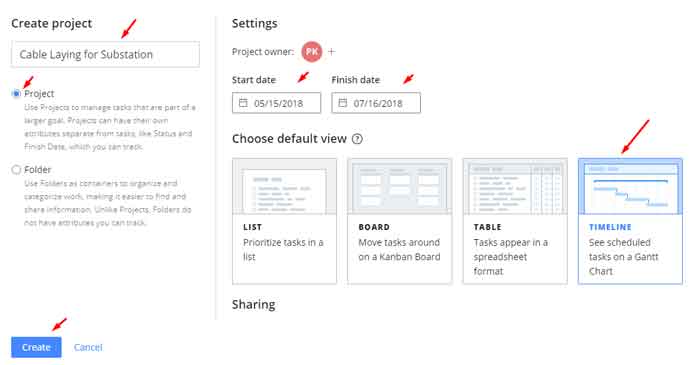
Then you will be provided with the option to enter the Project Name, Project Start Date, and Project End Date. You can pick the same from the above row # 3 of my sample data.
The Project Name is Cable Laying for Substation, the Project start date is 15/05/2018 and the Project End date is 16/07/2018.
Now Choose Timeline view and click Create. You can refer to the below screenshot.
How to Add Tasks to Gantt Chart
Now you can learn how to enter Tasks in Gantt Chart in Wrike online Project Management Application.
To do that, click on New Task. Enter the task name that you can find on row # 4 of my Google Sheet sample data above. See the same details below.
Task: Site Mobilization
Start Date: 15/05/2018
End Date: 25/05/2018
You have completed one task. Now you should repeat this procedure with all the tasks that you can find in my sample data screenshot above.
The second task in row # 5 is “Civil & Structural Work” and it’s in blue color. That means it’s the main task. So you can add this task just as the above Task 1.
Then there are two subtasks under it (in rows # 6 and 7) – Excavation for Cable laying & Cable Tray Erection for laying cable.
Add Subtasks in Gantt Chart
I will tell you how to add subtasks in the Gantt chart in Wrike.
Just point your cursor to the second task. You can see a small button for adding subtasks as below.
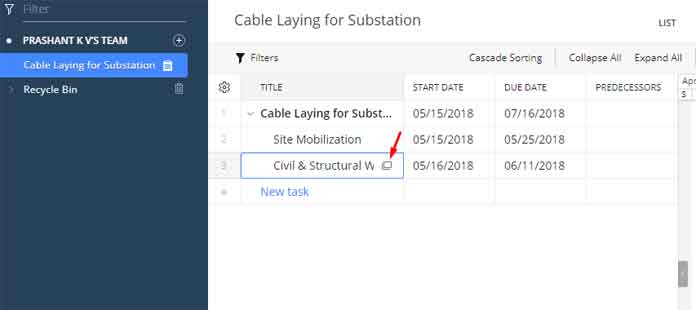
Click on that tiny button. On the popup screen select “Add Subtask”.
Actually, there are multiple options on this screen other than the subtask like start timer, add a dependency, attach files, etc.
I am skipping that right now as you first want to learn how to create a Gantt Chart using Wrike online.
Add the two subtasks and their start and end date. Look for the small calendar icon to add start and end dates. Once completed the entry close the popup window.
Similarly, add all the other main tasks and subtasks to complete the Gantt Chart.
Finished Gantt Chat and Scheduling – Yearly, Monthly, Weekly, and Daily
Actually, it’s very easy to add tasks and subtasks in the Wrike timeline view. You may only face the initial starting trouble with your first Gantt Chart. Once you learned, it’s just a child’s play to create interactive Gantt charts within minutes!
Here is my screenshot of my first Gantt Chart in Wrike that just after completing the tasks and subtasks entry.
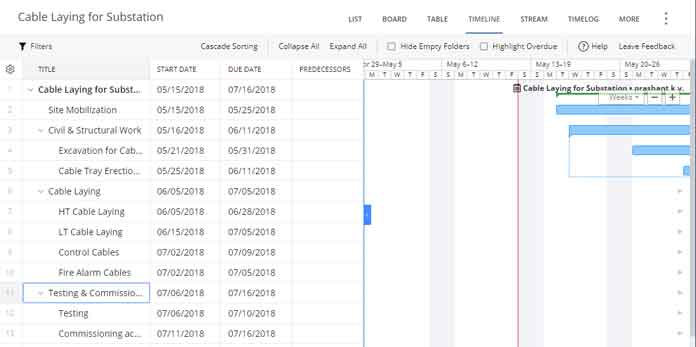
I know you may not be able to see the full bars on your screen. But as I’ve told you this chart is interactive. You can see the full bars and the task name next to the bars.
How to View Full Bars and Tasks Next to the Gantt Chart Bars in Single Screen in Wrike
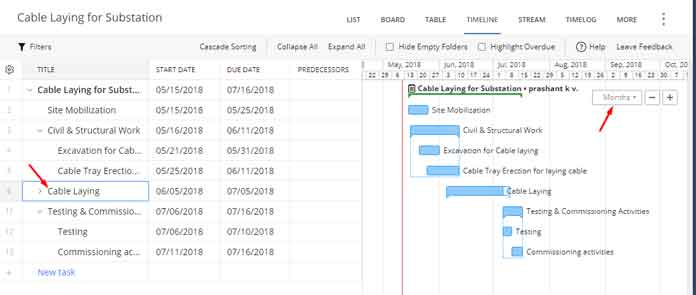
You have the freedom to view all the taskbars on a single screen. To do that change the schedule to “Months” as below.
Here is the month-wise scheduling in the Gantt chart. Also to cover all the tasks on a single screen I’ve hidden the subtasks of Cable Laying.
Both are marked on the below screenshot.
That’s all. This way you can create Gantt Chart online using Wrike.
Different Project View in Wrike Like Timeline | List | Board | Stream | Timelog
Just refer to the above screenshot. You can understand that the active view is Timeline. Please note that you can only view your schedule in Gantt Chart in Timeline view.
You can change the views just by clicking the View Name Tabs.
For example, when you click the Table, the view of your entered tasks would be as below. It looks like a Spreadsheet.
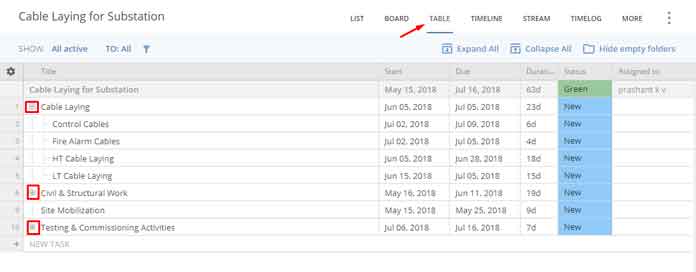
By default that subtasks will be grouped under the main task. You can expand or collapse all the grouped rows (subtasks) by clicking the appropriate button below the different view menu.
Also, you can manually expand or collapse each group by clicking the “+” or “-” button before the task names.
It resembles the new Google Sheets Row/Colum Grouping feature.
You May Like: How to Group Rows and Columns in Google Sheets
There are many other features that you can find yourself by clicking through different areas of your Gantt Chart.
Conclusion
If you are looking for an all-in-one and easy-to-understand project management and collaboration software, look no further. Wrike is one of the best solutions you can find. By using Wrike, you are able to get an up-to-date picture of your running project. Say goodbye to boring status meetings!


