


In Google Sheets, the Query is the suitable function to summarise data. No matter whether the data type is text, number or date. To create a daily/weekly/monthly/quarterly/yearly report summary, in Google Sheets, no doubt Query is the best.
A daily transaction is a part and parcel of every business, especially sales. Whatever your business you may have some data to record on daily basis. It can be sales, purchase or cash transactions.
Even a blogger does have his daily dose of data in the form site traffic, page impressions, CTR etc.
If this is the case, then you might want to make a summary of your daily transactions. Here are a few examples of how to create a daily/weekly/monthly/quarterly/yearly report summary in Google Sheets using Query.
You can use my formulas out of the box by adjusting your sales/purchase report columns as per my report format. I have included my sheet containing the formulas and demo data at the end of this tutorial.
Query to Create Daily/Weekly/Monthly/Quarterly/Yearly Report Summary
In Query, you can use the following scalar functions to create a summary report based on a date column. Date column here means a column that contains the transaction dates.
month()
quarter()
year()
Does these three scalar functions are enough?
I know what we want is a Query formula to create daily/weekly/monthly/quarterly/yearly report summary.
There are five types of date column summary. But for the daily report, the Query group clause is enough. For the weekly summary, we should use one date function that’s not in Query. You can see that in the formula examples below.
Query to Create Daily Report in Google Sheets
This is a mocked sales data. From this, I am going to create a daily summary of sales report.
The sales summary is just a basic one involving only two columns. That is column A and column F.

Note: Refer to my Google Sheets Functions Guide to learn Query as well as other popular functions.
Formula: Daily Sales Summary Involving Date and Total Qty. Columns
=QUERY(A1:F8,"Select A, sum(F) where A is not null group by A")
This is the Query in Cell I1. Some of you may wish to include the product name with the summary. Then you can use this Query formula.
Formula: Daily Sales Summary Involving Date, Product, and Total Qty. Columns
=QUERY(A1:F8,"Select A,C, sum(F) where A is not null group by A,C")
You will get a date wise and product wise daily summary report.
Query to Create Monthly Reports in Google Sheets
In the formulas to create daily/weekly/monthly/quarterly/yearly reports, except for the weekly summary report, all the formulas are almost identical. So I will detail the Query formula to create the Weekly report at the last part.

Formula: Monthly Sales Summary Involving Date and Qty. Columns
Here the difference lies in the use of the scalar functionmonth(). I’ve just underlined this addition in the above screenshot.
=QUERY(A1:F8,"Select month(A)+1, sum(F) where A is not null group by month(A)+1")
Tip: The Query scalar functionmonth() returns 0 for January and 11 for December. So you must add +1 to this function to get 1 for January, 2 for February and so on.
Formula: Monthly Sales Summary Involving Date, Product, and Qty. Columns
Needless to say, here also I have used themonth() scalar function.
=QUERY(A1:F8,"Select month(A)+1,C, sum(F) where A is not null group by month(A)+1,C")
Query to Create Yearly Reports in Google Sheets
As I have told you about the similarity of the Query to create daily/weekly/monthly/quarterly/yearly reports in Google Sheets. Here the scalar functionyear() makes the difference.
Formula: Yearly Sales Summary Involving Date and Qty. Columns
=QUERY(A1:F8,"Select year(A), sum(F) where A is not null group by year(A)")
Formula: Yearly Sales Summary Involving Date, Product, and Qty. Columns
=QUERY(A1:F8,"Select year(A),C, sum(F) where A is not null group by year(A),C")
Query to Create Quarterly Reports in Google Sheets
Replace theyear() scalar function in Query withquarter() to create a quarterly summary of the sales report.
Formula: Quarterly Sales Summary Involving Date and Qty. Columns
=QUERY(A1:F8,"Select quarter(A), sum(F) where A is not null group by quarter(A)")
Formula: Quarterly Sales Summary Involving Date, Product, and Qty. Columns
=QUERY(A1:F8,"Select year(A),C, sum(F) where A is not null group by year(A),C")
Query to Create Weekly Reports in Google Sheets
There is no scalar function calledweeknum() to use. That makes the following two formulas little messy. We must use here one Google Sheets date function called WEEKNUM with Query.
This function returns unique week numbers for each week. For example, the week number of 17/10/2018 is 42 and 23/10/2018 is 43.
You can test that as follows=weeknum("14/10/2018"). See how I am using the WEEKNUM function in Query.
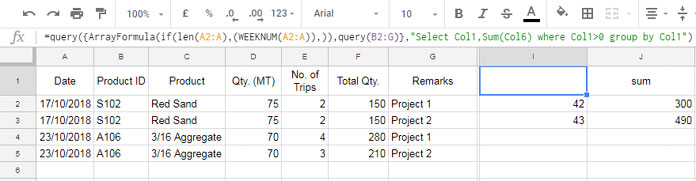
Formula: Weekly Sales Summary Involving Date and Qty. Columns
=query({ArrayFormula(if(len(A2:A),(WEEKNUM(A2:A)),)),query(B2:G)},"Select Col1,Sum(Col6) where Col1>0 group by Col1")
Formula: Weekly Sales Summary Involving Date, Product, and Qty. Columns
=query({ArrayFormula(if(len(A2:A),(WEEKNUM(A2:A)),)),query(B2:G)},"Select Col1,Col3, Sum(Col6) where Col1>0 group by Col1,Col3")
I know you need a detailed tutorial for the weekly summary report. You can follow this Google Sheets tutorial – How to Create A Weekly Summary Report in Google Sheets.
Additional Tips/Resources to Create Daily/Weekly/Monthly/Quarterly/Yearly Report Summary in Google Sheets.
1. Filter by Month and Year in Query in Google Sheets.
2. Month, Quarter, Year Wise Grouping in Pivot Table in Google Sheets.
3. How to Group Data by Month and Year in Google Sheets.
4. Google Sheets Query: How to Convert Month in Number to Month Name in Text.
Can I group by year, month, week day and say an elapsed time duration worked on.
And can I do the same thing by adding in the Project column too?
Hi, David,
Before trying, I wish to see a sample of your data (mockup) and your expected output.
Can you share one sheet via your reply below?
Hi Prashanth,
Your content is awesome and a lifesaver for me at the moment!
Quick question, though, on this.
Is it possible to query data across multiple years and have it count by year and quarter?
I’ve used the following to get the entries per year, and it’s worked:
=query(Sheet1!A:J,"select year(A), Count(A) Group By year(A)")And this gives me per quarter:
=query(Sheet1!$A:$J,"select Quarter(A), Count(A) Group By quarter(A)")Ideally, I’d like by year and quarter.
Many thanks in advance for your help,
Ian
Hi, Ian Leonard,
This may help.
=query(Sheet1!$A:$J,"select year(A),quarter(A),Count(A) where A is not null Group By year(A),quarter(A)")
Please include the WHERE clause in your formulas above to skip blank rows.
This is really helpful, thanks! How do you basically do this whilst maintaining a row for every day even if there isn’t a value for a day?
Hi, Penny,
I can hopefully help you if you can provide (share URL) a mockup sheet.
What if I want to sum the monthly mileage for a specific individual by day of the month?
I have a mileage log that lists the date, who the mileage is for, and how many miles were driven. There are multiple entries for each individual each day.
I want it to add all mileage (column I) of RK (one of the people in Column C) and have total ‘RK’ miles reported by day of the month.
I’ve been trying this:
=QUERY(A8:I100," select A where C='RK',sum(I) group by A")but it gives an error. Can’t seem to find a fix.Hi, Cindy,
The Query formula syntax is not correct. Please see my Query Clause order guide.
So, you should rewrite the formula as below.
=QUERY(A8:I100,"Select A, sum(I) where C='RK' group by A")Also, you should understand the changes in formulas as per regional settings.
The formulas in my tutorials are as per the LOCALE set to the UK in the File menu Spreadsheet settings.