The NORMDIST function in Google Sheets returns a value from the normal distribution—or the cumulative version of it—based on the value you specify, along with the given mean and standard deviation.
Google Sheets also supports the NORM.DIST function, which replaces the older NORMDIST. Both currently work—likely for backward compatibility—so you’re free to use either in your formulas.
The normal distribution is one of the most important probability distributions. It’s symmetrical around the mean and often appears in real-world data—like heights, test scores, or measurement errors—where values tend to cluster around a central peak.
Let’s take an example: the heights of 11 boys, age 11, as a sample from a population. The data is listed in range A1:B12 of my Google Sheets file:
| Height | Probability |
|---|---|
| 140 | 0.039 |
| 141 | 0.058 |
| 142 | 0.080 |
| 143 | 0.100 |
| 144 | 0.115 |
| 145 | 0.120 |
| 146 | 0.115 |
| 147 | 0.100 |
| 148 | 0.080 |
| 149 | 0.058 |
| 150 | 0.039 |
I’ve used a NORMDIST formula in array form in cell B2 to calculate the probability distribution shown above.
Bell Curve Output from NORMDIST in Google Sheets
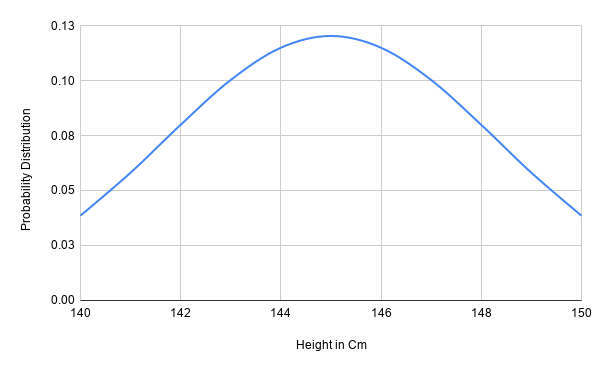
As you can see, the distribution forms a bell-shaped curve—commonly known as the bell curve or Gaussian curve.
👉 How to Create a Bell Curve in Google Sheets
Now, let’s explore how to use the NORMDIST or NORM.DIST function in Google Sheets using this sample data.
NORMDIST Function Syntax and Arguments in Google Sheets
Syntax:
NORMDIST(x, mean, standard_deviation, cumulative)(The same syntax applies to NORM.DIST as well.)
Arguments:
- x – The value for which you want the distribution.
- mean – The arithmetic mean (μ). You can calculate it using the AVERAGE function.
- standard_deviation – The standard deviation (σ). Use STDEV.P for population data or STDEV.S for a sample.
- cumulative – A logical argument that tells the function what kind of result you want:
- Use
FALSE(or0) to return the probability density function (PDF).
This gives you the relative likelihood of seeing a specific height—basically, how common that exact value is. - Use
TRUE(or1) to return the cumulative distribution function (CDF).
This tells you the percentage of students who are at or shorter than a given height.
- Use
In the example above, I’ve used FALSE as the last argument to calculate the probability density.
Example: How to Use the NORMDIST or NORM.DIST Function in Google Sheets
To calculate the normal distribution, we need the mean and standard deviation of our sample.
Step 1: Get the Mean
In cell D2:
=AVERAGE(A2:A12)Step 2: Get the Standard Deviation
Since this is sample data, use:
=STDEV.S(A2:A12)(Enter this in cell E2.)
Step 3: Use the NORMDIST Formula
In cell B2:
=NORMDIST(A2, $D$2, $E$2, 0)Then drag down the formula to apply it to the rest of the data (B3:B12).
You can also use NORM.DIST instead of NORMDIST; both will return the same results.
Note: The dollar signs ($D$2, $E$2) make the cell references absolute, so they don’t shift when dragged down.
NORMDIST Array Formula Use in Google Sheets
To skip dragging, you can use ArrayFormula to apply NORMDIST to the entire range in one go:
In cell B2:
=ArrayFormula(NORMDIST(A2:A12, $D$2, $E$2, 0))That’s it! The formula will automatically expand to B12.
Additional Notes
- The last argument (
0) means we’re returning the probability density (PDF). Use1orTRUEfor the cumulative distribution (CDF). - If the
standard_deviationis less than or equal to 0,NORM.DISTwill return a#NUM!error. - If
mean= 0,standard_deviation= 1, andcumulative= TRUE, the function returns values from the standard normal distribution.
(For that case, you can also use the dedicated NORM.S.DIST or NORMSDIST function.)
For example, both=NORMSDIST(2.4)and=NORM.DIST(2.4, 0, 1, TRUE)will return the same result.
Final Thoughts
That’s all about how to use the NORMDIST function in Google Sheets (or NORM.DIST, its updated version). It’s a powerful tool for working with probability distributions—especially useful for statistical analysis and visualizations like the bell curve.
Enjoy exploring stats in Sheets!


Nice article. Gets across the point in a short and concise manner, and didn’t beat around the bush.
Thank you so much for this! This was a huge help and saved me a bunch of time.
Hi, Morgan Christopher,
Thanks for your valuable feedback!