


")


")

")
")
 in Excel & Google Sheets")


Before diving into the formulas, let’s first clarify what it means to group and average unique values by category in Google Sheets. We’ll use the following sample data as an example:
| Name | Area | Qty. Sold |
| Cary | North | 10 |
| Cary | North | 10 |
| Cary | North | 10 |
| Cary | South | 20 |
| Daria | North | 10 |
| Daria | South | 5 |
| Daria | West | 15 |
In this dataset, we’ll show different methods to calculate averages by grouping categories.
Basic Average of Quantities Sold
To calculate the simple average of the quantities sold (column C), you can use the formula:
=AVERAGE(C2:C)This formula calculates the overall average without grouping by any category, returning the average of all quantity values in column C.
Average by Single Category (Name)
If you want to calculate the average quantity sold by each unique Name (ignoring duplicates within each group), the average will differ from a simple overall average. Let’s calculate it manually first to understand the concept:
- Cary‘s total sales are 10 + 10 + 10 +20 = 50
- Daria‘s total sales are 10 +5 +15 = 30
Thus, the average by name is (50 +30) / 2 = 40
This approach is referred to as Average by Unique Name.
Average by Multiple Categories (Name and Area)
If you want to consider both Name and Area while calculating the average, the calculation changes.
- Cary has two unique areas:
- North (total: 10 + 10 + 10 = 30)
- South (total: 20)
- Average for Cary: (30 + 20) / 2 = 25
- Daria has three unique areas:
- North (total: 10)
- South (total: 5)
- West (total: 15)
- Average for Daria: (10 + 5 + 15) / 3 = 10
This approach is referred to as Average by Unique Name and Area.
Calculating Unique Averages by Single Category
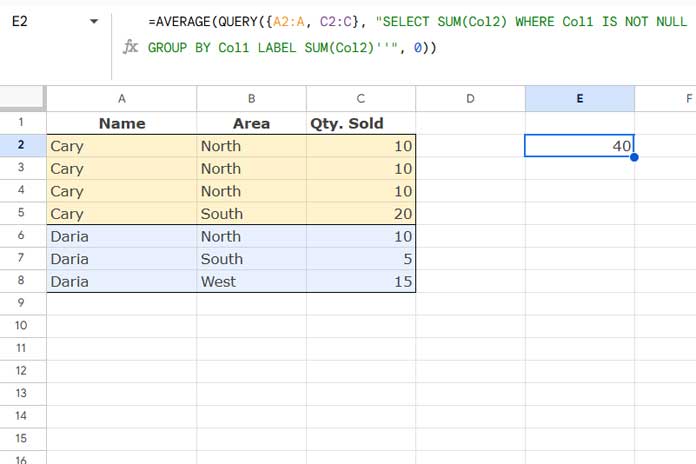
We’ll use the QUERY function to calculate unique averages by a single category. Here’s the formula to group and calculate unique values by a single category (e.g., Name):
=AVERAGE(
   QUERY({A2:A, C2:C}, "SELECT SUM(Col2) WHERE Col1 IS NOT NULL GROUP BY Col1 LABEL SUM(Col2)''", 0
   )
)
Explanation:
- Replace
A2:Awith the category column reference andC2:Cwith the column containing the values to be averaged. - This formula sums up quantities for each unique Name and calculates their overall average.
In this example:
- Cary’s total is 50, and Daria’s total is 30, resulting in (50 + 30) / 2 = 40
Calculating Unique Averages by Multiple Categories
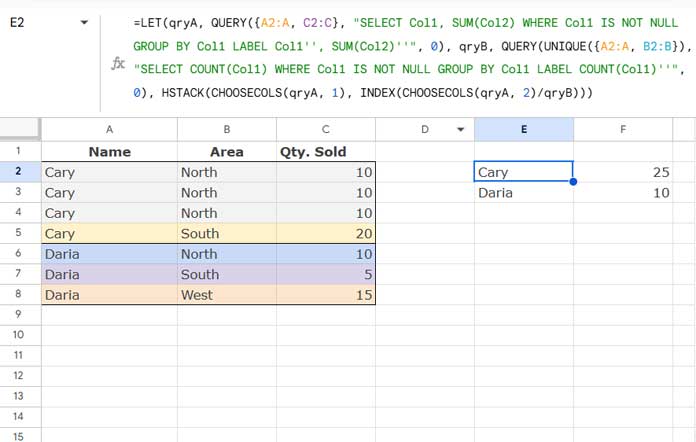
We can use two QUERY functions combined with the LET function to calculate unique averages by multiple categories (e.g., Name and Area). Here’s the formula, followed by an explanation:
=LET(
   qryA, QUERY({A2:A, C2:C}, "SELECT Col1, SUM(Col2) WHERE Col1 IS NOT NULL GROUP BY Col1 LABEL Col1'', SUM(Col2)''", 0),
   qryB, QUERY(UNIQUE({A2:A, B2:B}), "SELECT COUNT(Col1) WHERE Col1 IS NOT NULL GROUP BY Col1 LABEL COUNT(Col1)''", 0),
   HSTACK(CHOOSECOLS(qryA, 1), INDEX(CHOOSECOLS(qryA, 2)/qryB))
)
Explanation
The LET function simplifies the formula by assigning the queries to qryA and qryB, making it easier to reference them in calculations.
1. qryA:
QUERY({A2:A, C2:C}, "SELECT Col1, SUM(Col2) WHERE Col1 IS NOT NULL GROUP BY Col1 LABEL Col1'', SUM(Col2)''", 0)This query groups by the Name and calculates the total quantity sold for each name, returning:
| Cary | 50 |
| Daria | 30 |
2. qryB:
QUERY(UNIQUE({A2:A, B2:B}), "SELECT COUNT(Col1) WHERE Col1 IS NOT NULL GROUP BY Col1 LABEL COUNT(Col1)''", 0)This query counts unique Name and Area combinations. Using UNIQUE removes duplicate entries, and COUNT calculates the number of unique areas per name. The result:
| 2 |
| 3 |
3. Final Calculation:
HSTACK(CHOOSECOLS(qryA, 1), INDEX(CHOOSECOLS(qryA, 2)/qryB))CHOOSECOLS(qryA, 1)selects the first column fromqryA, which contains the names.INDEX(CHOOSECOLS(qryA, 2)/qryB)divides the total quantities fromqryAby the unique area counts fromqryB, calculating the average quantity sold per unique area.- HSTACK then horizontally combines the names from
qryAwith the calculated averages.
This results in:
| Cary | 25 |
| Daria | 10 |
- Cary’s average: 50/2 = 25
- Daria’s average: 30/3 = 10
This formula effectively calculates the unique averages by dividing the total quantity sold by the count of unique categories, giving a per-category average for each name.
Resources
- Find the Average of the Last N Values in Google Sheets
- Average of Top N Percent of the Values in Google Sheets
- Array Formula to Return Average of Every N Cell in Google Sheets
- Average by Month in Google Sheets (Formula Options)
- Calculating Running Average in Google Sheets (Array Formulas)
- Average of Smallest N Values in Google Sheets (Zero and Non-Zero)
- Calculating Rolling N Period Average in Google Sheets
- Google Sheets: Nested BYROW to Loop a Row-by-Row Average
- Reset Rolling Averages Across Categories in Google Sheets
- Google Sheets: Rolling Average Excluding Blank Cells and Aligning
- How to Calculate Average by Quarter in Google Sheets