Do you want to easily insert n number of blank rows in a table in Excel? You can use the following formula for that:
=DROP(REDUCE("", SEQUENCE(ROWS(range)), LAMBDA(acc, val, VSTACK(acc, EXPAND(CHOOSEROWS(range, val), n+1,, "")))), 1)When using this formula to insert blank rows between each record in a table, make the following changes:
- range – Replace with the range of the table.
- n – Replace with the number of empty rows you want between each row.
Things to Know
- The above is a dynamic array formula, so it will work in modern versions of Excel, such as Excel 365, which supports the REDUCE lambda function.
- The range can be a physical range or the output of functions such as
FILTER,SORT, or other combination formulas that produce array results. - This might affect performance if the table is very large due to the use of the
REDUCElambda function. - You can’t add values in the inserted empty rows. The formula will break and return a Spill error. If you want to insert empty rows between records in a table and enter values, you should copy the result and paste it as values in a new range.
Purpose of Inserting Blank Rows Between Each Row in a Range
If you need to handwrite additional information below each record, you can use this formula to insert 2-3 blank rows below each record and print the table. Then, you can manually add the necessary details. For example, this method can be useful for adding empty rows in a calendar.
Manually inserting an equal number of empty rows in a large dataset can be tedious. In that case, you can use this formula, then copy the result and paste it as values over the original data. This process takes just a few seconds.
These are the two main uses of inserting empty rows between rows in a table in Excel.
Example of Inserting Empty Rows in a Table in Excel
Assume you have the following sample data in B2:D6:
| Name | Department | Sales |
| Samuel | HR | 5000 |
| Aida | Finance | 7000 |
| Carly | IT | 6500 |
| David | HR | 4800 |
To insert 2 blank rows between each row in this table, follow these steps:
- Enter
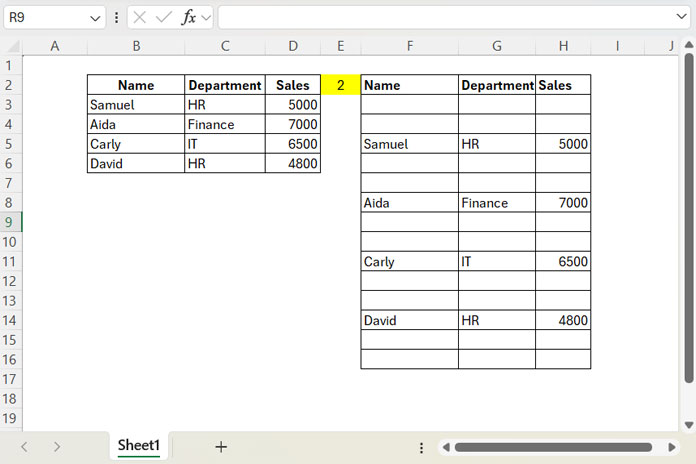
2(n) in cellE2. - Enter the following formula in cell
F2:
=DROP(REDUCE("", SEQUENCE(ROWS(B2:D6)), LAMBDA(acc,val, VSTACK(acc, EXPAND(CHOOSEROWS(B2:D6, val), E2+1,, "")))), 1)This will return the result in F2:H16 as follows:
How Do I Apply Paste Values?
To paste the result as values over the original data, follow these steps:
- Select
F2:H16. - Right-click and select Copy.
- Navigate to cell
B2. - Right-click and select Paste Values.
Formula Explanation
The EXPAND(CHOOSEROWS(B2:D6,val),E2+1,,"") function expands each row to n rows, where n is specified in cell E2. This ensures that n empty rows are added below each row.
This expanded row is stored in the accumulator (acc) of the REDUCE function and is vertically stacked with each row. The REDUCE function applies this operation to each row in the table.
The initial value in the accumulator is blank, which results in an extra empty row at the top. The DROP function removes this extra row.
The array generated by SEQUENCE(ROWS(B2:D6)) produces sequence numbers that match the number of rows in the table. These numbers are used to extract each row for processing.


Hi Prashanth, great posts!
Could you help with the following?
I’m trying to dynamically insert blank rows, but only after a change in the value of a column.
For example, there’s a date column, and the request is to insert a blank row only when the date changes — i.e., to visually group the lines by date.
Example:
someval someval 2025/11/1
someval someval 2025/11/1
someval someval 2025/11/2
someval someval 2025/11/2
someval someval 2025/11/2
someval someval 2025/11/3
Thanks!
Hi Aristotelis,
Thanks for your suggestion! I’ve already covered that — please check the Resources section at the bottom of the post for the tutorial titled “Insert a Blank Row After Each Category Change in Excel.”
Best,
Prashanth