

We can use nested BYROW functions to loop a row-by-row average in Google Sheets. This typically involves two tables: one that holds the values to average, and another that specifies the conditions for each loop iteration.
But I’m not just referring to a standard row-wise BYROW usage. I’m talking about a true loop—where each row is processed conditionally based on another dynamic input (like a row of checkboxes).
Let’s walk through the concept using simple and progressively complex examples.
Row-by-Row Average Using BYROW
To calculate the average of each row in the range C2:F8, use the following formula in cell H2:
=BYROW(C2:F8, LAMBDA(row, AVERAGE(row)))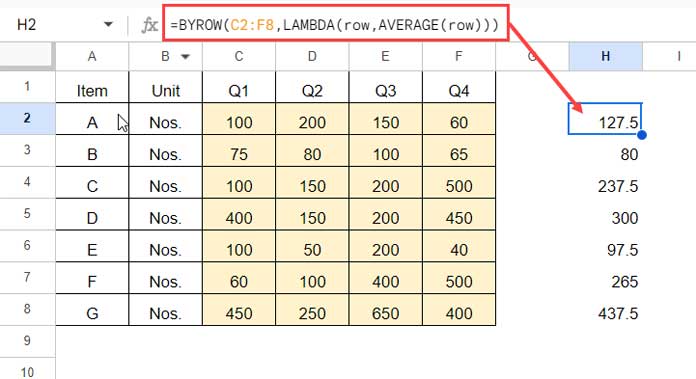
Explanation:
C2:F8: Range of values to average.LAMBDA(row, ...): Defines the row variable.AVERAGE(row): Computes the average of each row.
This formula spills automatically into H2:H8, equivalent to manually dragging =AVERAGE(C2:F2) down the column.
👉 You can learn more about this basic approach in my post: Average Array Formula Across Rows in Google Sheets.
Conditional Row-by-Row Average in Google Sheets
Let’s now move to a conditional average—for example, finding the average of values greater than 50 in each row.
In H2, you could write:
=AVERAGEIFS(C2:F2, C2:F2, ">50")And drag it down to apply it across all rows.
To do the same using BYROW:
=BYROW(C2:F8, LAMBDA(row, AVERAGEIFS(row, row, ">50")))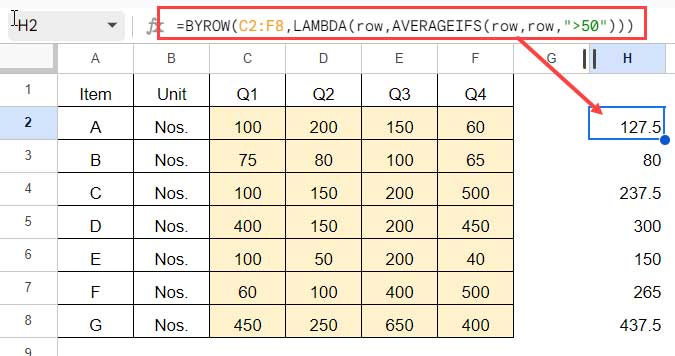
This formula checks each value in the row and returns the average of only those greater than 50.
Nested BYROW to Loop a Conditional Row-by-Row Average
Now comes the interesting part—looping a conditional row-by-row average using a second table of checkboxes.
Scenario Setup
- Table #1 (
C2:F8): Sales data for 7 products across Q1–Q4. - Table #2 (
C12:F15): A 4×4 matrix of checkboxes indicating which quarters to include in each loop.

Each row in Table #2 represents a different condition—for example:
C12:F12 → TRUE, FALSE, FALSE, FALSE
This row tells us to average Q1 only.
Step 1: Conditional Row-by-Row Average Based on a Single Row of Conditions
Let’s say C12:F12 has the values TRUE, FALSE, FALSE, FALSE. Then this formula in H2:
=AVERAGEIFS(C2:F2, $C$12:$F$12, TRUE)…returns the average of Q1 for each row in Table #1. You can drag it down to apply it row-wise.
Now with BYROW:
=BYROW(C2:F8, LAMBDA(row, AVERAGEIFS(row, C12:F12, TRUE)))This version spills automatically and is dynamic.
Step 2: Looping the Row-by-Row Average Using Nested BYROW
Let’s extend this idea further. Suppose C12:F15 has multiple rows of TRUE/FALSE checkboxes.
We now want to generate four different conditional row-by-row averages at once:
- Use
C12:F12→ output toH2:H8 - Use
C13:F13→ output toI2:I8 - Use
C14:F14→ output toJ2:J8 - Use
C15:F15→ output toK2:K8
Instead of four separate formulas, we can nest BYROW to handle this in one go:
=TRANSPOSE(
  BYROW(C12:F15, LAMBDA(criteria,
    TOROW(
      BYROW(C2:F8, LAMBDA(row, IFERROR(AVERAGEIFS(row, criteria, TRUE), 0)))
    )
  ))
)
Explanation of the Nested BYROW Formula
- Outer BYROW: Loops over each row in
C12:F15(each condition row). - Inner BYROW: Loops over each row in the data table (
C2:F8) using the current condition. - AVERAGEIFS(row, criteria, TRUE): Applies the conditional average for selected quarters.
- TOROW: Converts column output from the inner BYROW to a row so results align horizontally.
- TRANSPOSE: Flips the final output from horizontal to vertical, giving us a nice 4-column × 7-row result.
- IFERROR(…, 0): Prevents errors when all checkboxes are unchecked for a row.
Wrap-Up
By nesting BYROW, you can elegantly loop conditional row-by-row averages across multiple conditions—all in one formula.
This technique is especially useful when you’re working with toggle controls (checkboxes or Boolean inputs) and want to dynamically adjust your row-level calculations in bulk.
Related Resources
- Calculate the Average of Visible Rows in Google Sheets
- Calculating Running Average in Google Sheets (Array Formulas)
- Calculating Simple Moving Average (SMA) in Google Sheets
- Weighted Moving Average in Google Sheets (Formula Options)
- Dynamic Moving Average in Excel
- Calculating Rolling N Period Average in Google Sheets
- Reset Rolling Averages Across Categories in Google Sheets
- Google Sheets: Rolling Average Excluding Blank Cells and Aligning
