Learn how to count unique values in Google Sheets QUERY using clear, practical methods that return results as a table.
Counting unique values helps you better understand your data. For example, instead of counting total sales entries per day, you may want to know how many distinct products were sold each day.
The regular QUERY function counts rows, not distinct values. In this tutorial, you’ll learn two proven ways to count unique values using QUERY—starting with the simplest and most effective method.
Quick Solution: Count Unique in Google Sheets QUERY
If your goal is to count distinct items per group (for example, unique products per date), use QUERY together with UNIQUE.
=QUERY(
  UNIQUE(HSTACK(A1:A, B1:B)),
  "select Col1, count(Col2) where Col1 is not null group by Col1", 1
)
This formula returns a clean table showing each date and the unique count of items sold on that date.
Sample Data Explained
The sample data contains three columns:
- Date – Sale date
- Item – Product name
- Qty – Quantity sold
| Date | Item | Qty |
|---|---|---|
| 10/11/2023 | Apple | 100 |
| 10/11/2023 | Apple | 150 |
| 10/11/2023 | Banana | 100 |
| 10/11/2023 | Banana | 150 |
| 11/11/2023 | Oranges | 50 |
| 11/11/2023 | Oranges | 50 |
| 11/11/2023 | Oranges | 5 |
On 10/11/2023, there were:
- 2 sales of Apples
- 2 sales of Bananas
Total sales entries = 4
Unique product count = 2
This is exactly what the QUERY + UNIQUE method calculates.
Method 1: Count Unique in QUERY Using UNIQUE (Detailed Explanation)
Logic Behind the Formula
To count unique values in QUERY, we first need a dataset where duplicate combinations are removed.
We do this by:
- Combining the group column (Date) and unique column (Item)
- Extracting unique combinations
- Running QUERY on that cleaned dataset
Instead of relying on adjacent columns, we use a flexible approach:
=UNIQUE(HSTACK(A1:A, B1:B))
This returns unique Date–Item pairs, regardless of column positions.
QUERY Formula
=QUERY(
  UNIQUE(HSTACK(A1:A, B1:B)),
  "select Col1, count(Col2) where Col1 is not null group by Col1", 1
)
Result:
A table showing each date and the number of distinct items sold.
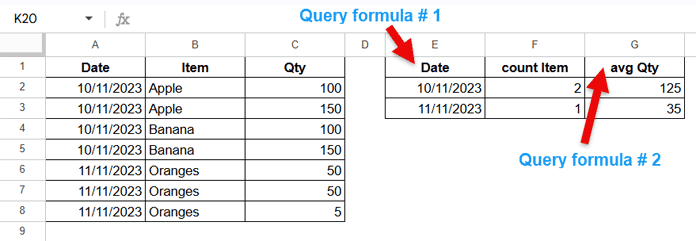
| Date | count Item |
|---|---|
| 10/11/2023 | 2 |
| 11/11/2023 | 1 |
Adding Another Aggregation (Average Quantity)
Now let’s calculate the average quantity sold per date.
=QUERY(
  HSTACK(A1:A, C1:C),
  "select avg(Col2) where Col1 is not null group by Col1", 1
)
This returns the average of the Qty column grouped by Date.
You can place this formula next to the first QUERY result and align it as an additional column in the final output table.
👉 For a complete overview of aggregation functions like SUM, AVG, COUNT, MIN, and MAX, see the hub guide: How to Sum, Avg, Count, Max, and Min in Google Sheets QUERY
Method 2 (Advanced): Count Unique in QUERY Using a Running Count
Use this method only if you need multiple aggregations in a single QUERY or want full control over how uniqueness is calculated.
Helper Column: Running Count
To generate a running count for Date–Item combinations, enter the following formula in cell D1:
=ArrayFormula(
  VSTACK(
    "Helper",
    COUNTIFS(A2:A&B2:B, A2:A&B2:B, ROW(A2:A), "<="&ROW(A2:A))
  )
)
This returns:
- 1 for first occurrence
- 2, 3, … for subsequent duplicates
Convert the Running Count into a Unique Flag
To convert the running count into a unique flag, modify the formula in cell D1 as follows:
=ArrayFormula(
  VSTACK(
    "Helper",
    (COUNTIFS(A2:A&B2:B, A2:A&B2:B, ROW(A2:A), "<="&ROW(A2:A))<2)*1
  )
)
Now, each unique Date–Item pair has a value of 1, and all duplicates return 0.
QUERY Using the Helper Column (Running Count)
Count Unique Items per Date
=QUERY(
  A1:D,
  "select Col1, sum(Col4) where Col1 is not null group by Col1", 1
)
Result:
| Date | sum Helper |
|---|---|
| 10/11/2023 | 2 |
| 11/11/2023 | 1 |
Count Unique + Average Quantity Together
=QUERY(
  A1:D,
  "select Col1, sum(Col4), avg(Col3) where Col1 is not null group by Col1", 1
)
This produces:
- Unique item count
- Average quantity
- In a single QUERY result table
Result:
| Date | sum Helper | avg Qty |
|---|---|---|
| 10/11/2023 | 2 | 125 |
| 11/11/2023 | 1 | 35 |
Conclusion
You can count unique in Google Sheets QUERY using two approaches:
- QUERY + UNIQUE → Best for most use cases (recommended)
- Running count helper column → Advanced, flexible, multi-aggregation scenarios
If you only need a number, functions like COUNTUNIQUEIFS may be simpler. But when you need structured, tabular output, QUERY is the best tool.


