


")


")

")
")
 in Excel & Google Sheets")


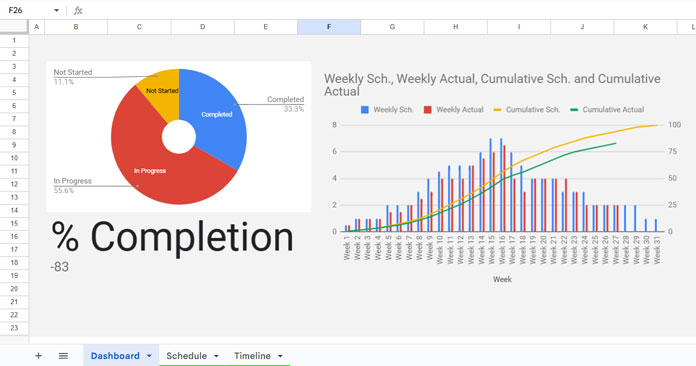
This tutorial walks you through the features and functionality of a custom-built Project Status Dashboard in Google Sheets. This dashboard provides a comprehensive overview of your project’s progress with three key visualizations and supporting data tabs.
You can find the download link for the template at the end of this tutorial.
Key Features of the Project Status Dashboard
- Scorecard Chart: Displays the total percentage of project completion out of 100 weightage.
- Pie Chart: Shows the percentage of tasks categorized by their status (e.g., “In Progress,” “Completed,” “Not Started”).
- Combo Chart: Provides a detailed comparison of scheduled vs. actual weightage, along with cumulative schedule and cumulative percentage progress.
In addition to the “Dashboard” tab, there are two other tabs in the sheet named “Schedule” and “Timeline.” The dashboard uses the data from these tabs to plot the charts. Let’s understand how to use these tabs.
Schedule Tab for Weekly Progress Tracking Table
The Schedule tab contains the following table:
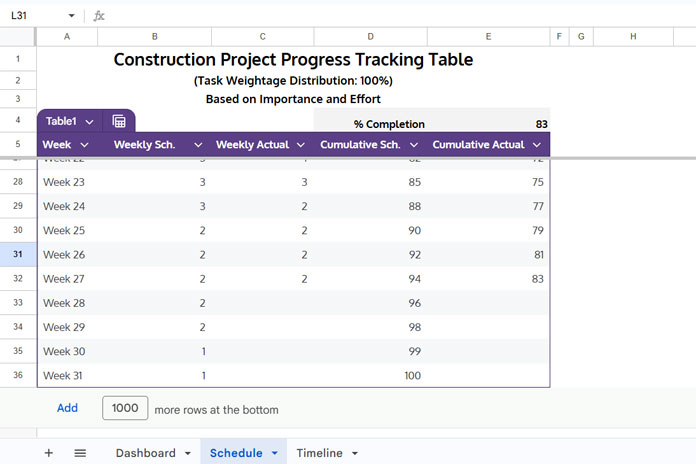
The purpose of this table is to help project managers compare planned (scheduled) progress against the actual progress achieved, providing both weekly and cumulative insights. Below is a breakdown of the columns and their significance:
- Week (Column A): Represents the sequential week number in the project schedule.
- Weekly Sch. (Column B): Indicates the percentage of the total work planned for completion during the respective week. This value is derived from the project’s weightage distribution.
- Weekly Actual (Column C): Shows the actual percentage of work completed during the respective week.
- Cumulative Sch. (Column D): Represents the cumulative percentage of work planned to be completed by the end of each week.
- Cumulative Actual (Column E): Reflects the cumulative percentage of actual work completed by the end of each week.
Instructions:
- Enter weightage values in Column B (B6:B) corresponding to each week. Total weightage is distributed among tasks based on their importance or effort.
- Record your actual percentage completion in Column C (C6:C).
- Columns D and E will be calculated automatically.
The data in this table will be used to create the Scorecard Chart and the Combo Chart in the Project Status Dashboard sheet.
To add more records to the table, hover over the last cell in the first column. A + button will appear. Click it to insert a new row with the formulas in Columns D and E automatically filled.
What If I Have a Monthly Schedule?
If you want to create a project dashboard to monitor monthly progress:
- Replace week numbers in Column A with month names.
- Enter the monthly schedule (% weightage distribution) in Column B.
- Record the monthly progress in Column C.
- Update table titles accordingly.
Using the Timeline Tab for Task Breakdown
The Timeline tab provides a breakdown of tasks for the Gantt chart and Pie Chart.
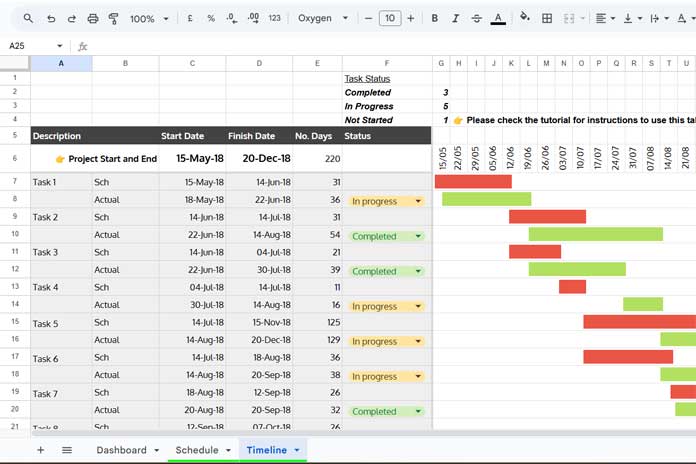
Instructions:
- Project Dates: Enter your project start and end dates in C6 and D6, respectively.
- Task Details:
- Enter task names in A7:A, leaving one empty cell between each task, as two rows are dedicated to each task (one for scheduled start and end, and another for actual start and end).
- Input the scheduled and actual task start and end dates in Columns C7:C and D7:D.
- Select the status of each task in F7:F (e.g., “Not Started,” “In Progress,” “Completed”).
- Adjust Rows:
- Check row #6 for the last non-empty column with a date.
- Adjust the merging of rows below accordingly.
- Add/Delete Rows:
- If you have fewer tasks, delete unnecessary rows. If you have more tasks, copy the formulas in Column G down to accommodate additional tasks.
This tab not only supports the Project Status Dashboard but also provides a clear picture of task progress.
Downloading the Project Status Dashboard
To get the free Project Status Dashboard, click the button below:
This will open a preview of the template. Make a copy of it to start using it.
Resources
Here are some additional resources to help you enhance your project tracking in Google Sheets:
- Create Gantt Chart Using Formulas in Google Sheets
- Creating a Gantt Chart with Stacked Bar Chart in Google Sheets
- How to Create a Gantt Chart with Sparkline in Google Sheets
- Split a Task in Custom Gantt Chart in Google Sheets
- Multi-Color Gantt Chart in Google Sheets
- Days Remaining in Gantt Chart in Google Sheets
- Date Filter in Gantt Chart in Google Sheets
- Track Remaining Days in Tasks with Sparkline Gantt Charts
- Steps to Create a Weekly or Monthly Progress Chart in Google Sheets
- How to Create a Percentage Progress Bar in Google Sheets
- How to Create an In-Cell Progress Bar in Excel
- How to Create an S-Curve Chart in Google Sheets