You can insert interactive and dynamic tables into your WordPress posts by utilizing Table Charts in Google Sheets. You don’t need any coding knowledge for this.
The most straightforward way to insert WordPress tables into a post is to use the built-in method within the Gutenberg block. To do this, click on the + (Add Block) button, and then select the ‘Table’ icon.
You can specify the number of rows and columns and then manually enter the table contents. This creates a basic table that may meet most of your needs.
However, you can leverage Google Sheets to insert interactive tables into your WordPress posts or pages, which offers four key advantages:
- You can easily import a data table from Google Spreadsheet to WordPress.
- It supports page navigation within the table.
- You don’t need to edit the post to update the table content.
- You don’t need to insert an additional WordPress plugin specifically for tables.
I do not recommend using plugins to add tables, as they can sometimes have a negative impact on your site’s speed. However, there may be lightweight plugins available as well.
Introduction to Interactive Google Sheets Tables
Google Sheets is a highly popular cloud-based spreadsheet application. Its capabilities for data manipulation and visualization are extensive.
One of the main advantages of Google Sheets is that it’s free to use.
This means you can insert interactive tables in your WordPress posts without spending a single penny.
The inserted table will look and function as shown below. If you are content with this type of responsive table in WordPress, you can proceed with the tutorial.
How to Insert Interactive Tables in WordPress Posts Using Google Sheets
I will use the Google Sheets Table Chart feature to insert an interactive table into a WordPress website. As a result, this tutorial will also teach you how to create a Table Chart in Google Sheets.
I typically utilize Table Charts in Google Sheets for creating dashboard reports and publishing interactive tables on the web.
Here are the steps to create a Table Chart in Google Sheets.
Creating a Table Chart in Google Sheets
First and foremost, prepare your table (Google Sheets data) for insertion into your WordPress post in Google Sheets. Assuming you have some familiarity with spreadsheets, you are likely familiar with the concept of a “table.”
In technical terms, a table is a grid consisting of rows and columns used to organize and present data. To create a table, add labels (titles) in the top row and enter the corresponding values below.
Steps to Create a Table Chart in Google Sheets:
Select your data using your mouse or Shift + arrow keys. Then, from the “Insert” menu, choose “Chart.”
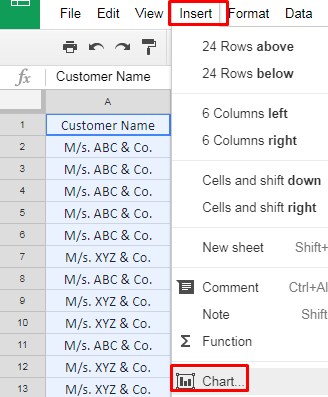
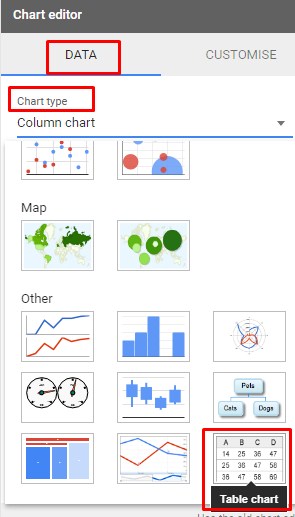
In the “Chart editor” that appears on the right, select “Table Chart” under “Chart type.” Google Sheets will instantly insert the Table Chart.
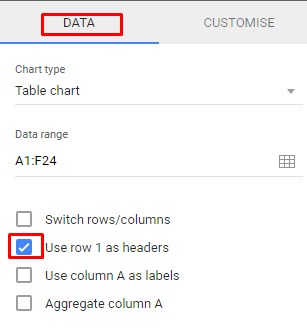
Under the “Setup” tab of the Chart Editor (previously labeled “Data”), check “Use row 1 as headers.”
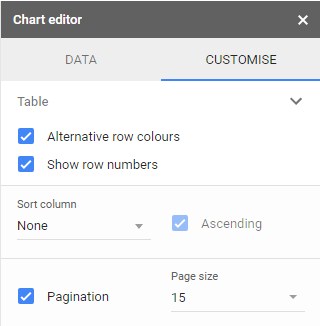
Navigate to the next tab in the chart editor labeled “Customize” and click on the “Table” section.
- Enabling “Alternative row colors” will shade alternate rows in your table.
- “Show row numbers” will display row numbers on the left.
- Click “Pagination” if you want to control page numbers in the inserted table in WordPress and specify the total number of rows to appear on each page under “Page size.”
We have successfully created a Table Chart in Google Sheets. Now, let’s proceed to see how to insert this interactive table into a WordPress post.
Steps to Insert Interactive Tables Using Google Sheets in WordPress Posts
To insert the Google Sheets Table Chart into your blog post, you need an embed code. Here’s how to obtain the embed code for your newly created Table Chart:
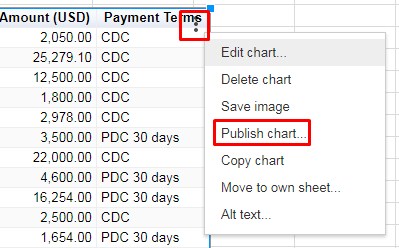
Click on the Table Chart you’ve just created. In the top right corner of the chart, you will find three vertical dots (kebab menu).
Click on this menu and select “Publish chart.”
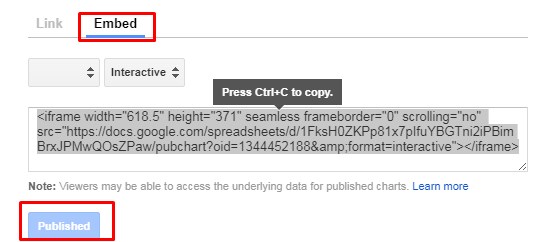
Go to the “Embed” tab and click “Publish”. Ensure that the “Automatically republish when changes are made” option is checked for auto-sync.
Copy the code, and now we have completed the Google Sheets part of inserting interactive tables into posts or pages in WordPress.
To insert the table chart into your post on your WordPress site, follow these steps:
- Click on the “Add Block” button and select “Custom HTML.” If you can’t locate it, click on “Browse All” or search for it after clicking the “Add Block” button.
- Paste the code and click “Preview.”
This way, you can easily insert interactive tables in WordPress posts without the need for a plugin, HTML, or CSS coding.


Thank you for this! I will use this for better-looking tables in WordPress.
However, when I have tried it just now, the table chart is not interactive. I cannot click on the headers to sort. It behaves just like an image.
Thoughts?
This is great and the steps were really helpful. I have one question. What is the time lag for the refresh of data?
I published the chart and then updated some data but I do not see the changes reflected on the website. I have selected the re-publish option.
Hi, Vaish,
Did you enable the option “Automatically republish when changes are made”
This checkbox is under the menu File > Publish to the web > Published content and settings.
Best,
Hi
Great post. I love the way it is integrated. I tried it on my wordpress and I have a very small iframe with no data.
Any ideas?
Thanks,
Brendan
Make sure you are not using wordpress.com as it does not allows tags like CSS, style, iframe, script etc. also set width and length of the iframe, secondly make sure to publish the sheet as a public. Private and protected sheets you won’t be able to fetch.
Add height and Width inside the frame and adjust according to it.