The VARA function in Google Sheets is one of four functions that calculate sample variance: VAR, VAR.S, VARA, and DVAR. Among them, VARA uniquely includes text and Boolean values in its calculation.
Before we dive into how VARA works and when to use it, let’s clarify two key concepts: variance and sample vs. population.
Sample vs. Population
To understand when to use VARA, it’s important to distinguish between a sample and a population:
- Population: All individuals or items under consideration.
Example: All students in a college. - Sample: A subset taken from the population.
Example: All students in the Physics department of that college.
In real-world scenarios, it’s often impractical to collect data from an entire population. So we work with a sample to estimate population statistics like mean and variance.
What Is Variance?
Variance measures how much the values in a dataset deviate from the average (mean). A higher variance indicates values are more spread out.
Here’s a quick manual example to illustrate how variance is calculated:
Manual Example of Variance Calculation
Sample values: 5, 10, 15
- Find the mean: (5+10+15)/3 = 10
- Calculate squared differences from the mean: =(5-10)^2 =25, (10-10)^2 =0, (15-10)^2 = 25
- Sum of squared differences: =25+0+25 = 50
- Divide by sample size – 1 (n – 1): 50/3 = 25
So, the sample variance is 25.
Introduction to VARA and Its Sibling Functions
Google Sheets provides four functions for calculating the variance of a sample:
| Function | Category | Description |
|---|---|---|
| VAR | Statistics | Legacy function for sample variance (replaced by VAR.S). |
| VAR.S | Statistics | Modern version of VAR; use this for sample variance. |
| DVAR | Database | Used with structured data; supports filtering by criteria. |
| VARA | Statistics | Like VAR.S, but includes text and Boolean values in calculations. |
Syntax: VARA Function in Google Sheets
Function Syntax
VARA(value1, [value2, ...])Arguments
value1: Required. A value or range representing the sample.value2: Optional. Additional values or ranges.
If only one value is provided, VARA will return a #DIV/0! error. If no values are specified, it returns #N/A.
While officially you can pass 1 to 30 arguments, Google Sheets supports many more—so don’t worry about limits in practice.
Example: Using VARA in Google Sheets
Using the same sample values:
=VARA(5, 10, 15)If those values are stored in cells A1:A3, you can also use:
=VARA(A1:A3)Output: 25
This matches our manual calculation earlier.
How VARA Handles Blank, Text, and Boolean Values
This is where VARA differs significantly from VAR or VAR.S.
| Value Type | Treated As |
|---|---|
| Blank cells | Ignored |
| Text strings | 0 |
| FALSE | 0 |
| TRUE | 1 |
So if your dataset includes survey results like "Yes", "No", or TRUE/FALSE, VARA will process them—unlike VAR.S, which skips non-numeric values.
Conditional Variance Using VARA with FILTER or QUERY
You can apply criteria when using VARA by nesting it with functions like FILTER or QUERY.
Sample Scenario:
You have a dataset of people’s heights by gender and want to find the variance in height only for males.
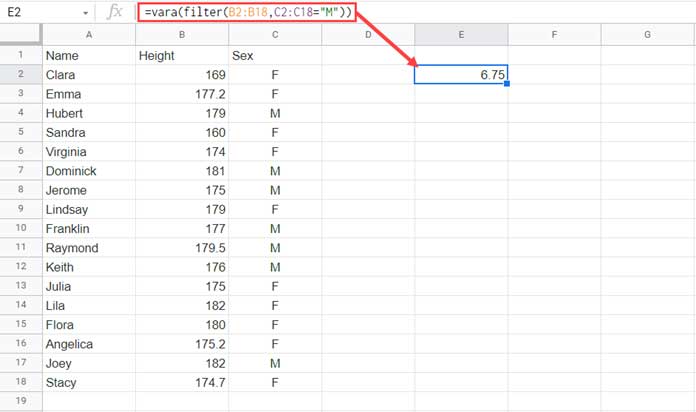
Assume:
- Heights are in column B
- Gender is in column C
- Data range is A2:C18
Using VARA + FILTER:
=VARA(FILTER(B2:B18, C2:C18 = "M"))Using VARA + QUERY:
=VARA(QUERY(A1:C18, "SELECT B WHERE C = 'M' LABEL B ''"))The LABEL B '' part removes the column label. Otherwise, VARA may treat it as text (i.e., 0) and skew the result.
Final Thoughts on Using the VARA Function in Google Sheets
Use VARA when your dataset includes text or logical values (TRUE/FALSE) and you want those to be factored into the variance calculation.
For purely numeric data, consider using VAR.S for clarity and simplicity.


