You can use the RRI function in Google Sheets to calculate the Compound Annual Growth Rate (CAGR) of an investment. Though Google Sheets doesn’t have a dedicated CAGR function, RRI is the built-in alternative for that.
In other words, the RRI function tells you the fixed annual interest rate required for an investment to grow from its starting value (present value) to its ending value (future value) over a given number of periods (typically years).
Calculate CAGR Manually in Google Sheets (Without RRI)
Even without a built-in function, you can calculate CAGR manually using this formula:
CAGR = (future_value / present_value) ^ (1 / number_of_years) - 1
Let’s look at an example:
- Nper (Number of years): 5
- Pv (Present Value): 10,000
- Fv (Future Value): 15,000
Using the manual formula:
=((15000/10000)^(1/5))-1
This returns 8.45% as the compound annual growth rate.
But you can do this even more easily using the RRI function in Google Sheets.
Syntax of the RRI Function in Google Sheets
RRI(number_of_periods, present_value, future_value)Arguments:
- number_of_periods (Nper) – Number of periods (typically years)
- present_value (Pv) – Initial value of the investment
- future_value (Fv) – Ending value of the investment
Example: RRI Function in Action
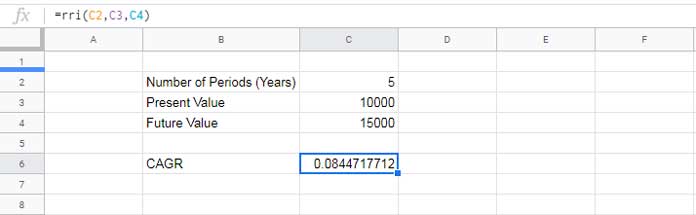
Let’s say:
- C2: Number of periods =
5 - C3: Present value =
10000 - C4: Future value =
15000
The formula:
=RRI(C2, C3, C4)Will return 0.084471771, which is the CAGR in decimal form.
How to Format RRI Output as a Percentage in Google Sheets
There are two ways to format the output from decimal to percentage:
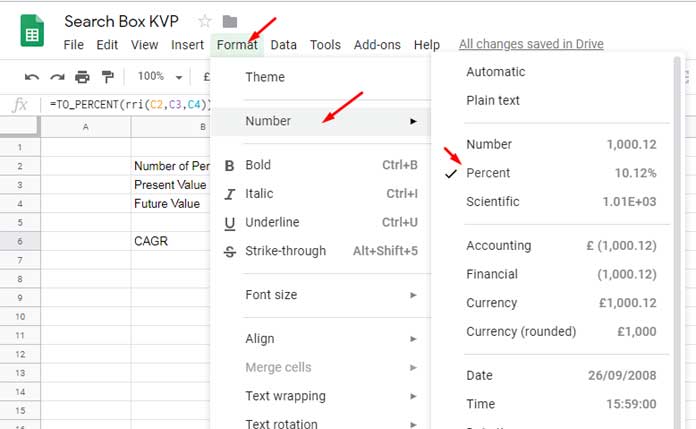
1. Using the Format Menu:
- Select the output cell (e.g.,
C6) - Go to Format > Number > Percent
2. Using a Function:
Wrap the RRI function inside TO_PERCENT:
=TO_PERCENT(RRI(C2, C3, C4))This will directly return the CAGR as a percentage (e.g., 8.45%).
RRI Function in Google Sheets – Common Errors and Fixes
#NUM! Error
Occurs when:
- Pv or Fv is a negative number (except Nper).
- Pv is
0– you can’t start from zero in compounding.
#DIV/0! Error
- Happens when Nper is
0or blank.
#VALUE! Error
- This usually appears when you provide non-numeric inputs (e.g., text).
- Note: Numbers stored as text will still work as long as they’re valid numerically.
Conclusion
The RRI function in Google Sheets is a simple but powerful tool for calculating compound annual growth rate, whether for investments, business revenue, or performance metrics.
While the manual CAGR formula works well, RRI makes the job faster and cleaner—especially when working with dynamic or large datasets.


