


First of all, let me explain the benefit of using the Quartile function in Google Sheets over finding the quartiles manually.
To find the quartiles manually, the data must be ordered (sorted) from least to greatest. But you can use the Quartile function in Google Sheets in a sorted or unsorted dataset.
Quartiles are actually three cut off points in an array or range. Mark the data in the middle (median), that results in two halves. Mark the middle of each half again. So you will get the three cut off points (quartiles).
There are five quartile numbers that you can use in the Quartile function and they are 0, 1, 2, 3 and 4.
In this, the quartile number 0 returns the minimum value (similar to the MIN function) in the dataset and the number 4 returns the maximum (similar to the Max function) value. See the syntax below to understand about the ‘quartile numbers’ used in the function.
The Syntax of the Quartile Function in Google Sheets:
QUARTILE(data, quartile_number)Arguments:
data – The array/range containing the dataset to consider.
quartile_number – Which quartile value to return (numbers 0 to 4).
| 0 | Returns the minimum value in the array (MIN). |
| 1 | Returns the value closest to the first quartile in the array. |
| 2 | Value in the array closest to the median (MEDIAN). |
| 3 | Value in the array closest to the third quartile. |
| 4 | Returns the maximum value in the array (MAX). |
Examples to the Use of the Quartile Function in Google Sheets
I have used all the quartile_numbers in the below examples. Please see the screenshot for the formulas in cell D2 to H2 and the description scribbled in blue ink just below that.
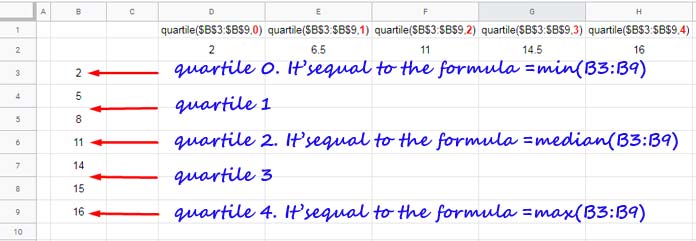
As you can see the MIN, MEDIAN and MAX formulas can replace the quartile numbers 0, 2 and 4 respectively.
Let me show you how to find the Quartiles manually in Google Sheets. I am using the same above dataset for the examples.
Finding Quartiles Manually in Google Sheets
I am leaving quartile numbers 0 and 4 as it’s min and max. Let me begin with the median which is quartile number 2.
You can find the median of a dataset manually by eliminating each number, one from the beginning of the dataset and another from the end until you find the middle of the data set. Of course, the data must be sorted before doing this.
We can visualize that as below.
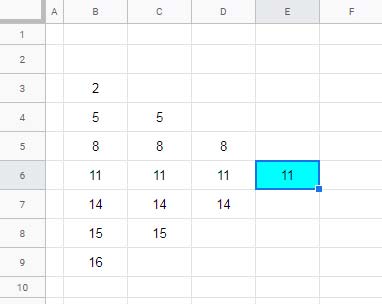
While eliminating the numbers, finally if you end up in two numbers, find the average of that numbers. It is not applicable in the above example.
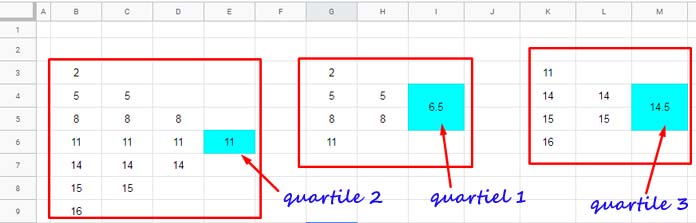
Since we have the median (quartile 2) it is easy to find the quartile 1 and 3. Take each half and find the median of them.
That’s all about the use of the QUARTILE statistic function in Docs Sheets.