In a recent tutorial, I explored the use of the DB function in Google Sheets. During my research, I discovered that this function operates slightly differently in Excel. In this comparison of the DB function in Excel versus Google Sheets, I’ll highlight these differences.
Other depreciation functions, such as SLN, SYD, DDB, and VDB, function similarly in both Excel and Google Sheets, leaving little room for comparison.
Interested in learning more about financial functions? Check out my Google Sheets Functions Guide!
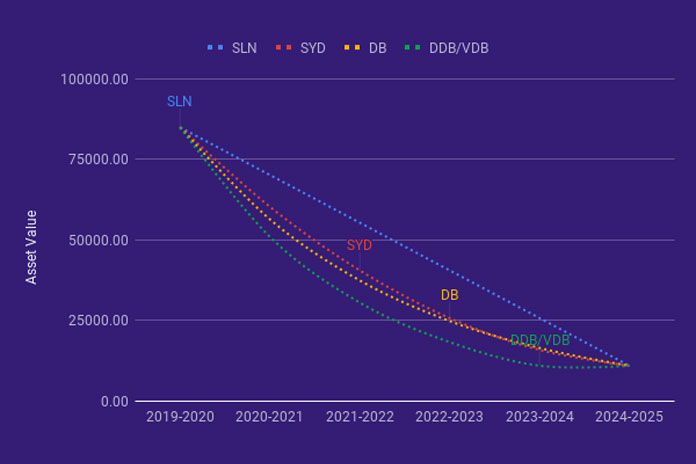
You may use different depreciation methods for your company’s assets, whether they be a car, laptop, or other equipment. The following chart illustrates the depreciation curves for assets:
| A | B | |
| 1 | Initial Cost of Asset | $85,000.00 |
| 2 | Salvage (scrap value) | $11,000.00 |
| 3 | Life (the useful life) | 5 |
Since I’ve already covered the DB function in Google Sheets, let’s first introduce the DB function in Excel, after which we can dive into the comparison.
How to Use the DB Depreciation Function in Excel
The syntax of the DB function is the same in both Excel and Google Sheets:
Syntax:
DB(cost, salvage, life, period, [month])I assume you’re familiar with the arguments in this function, as they are quite similar across all depreciation functions. If you have any questions, feel free to check my tutorial on financial functions or refer to the image below.
DB Formula Example in Excel
Here’s an example of how to use the DB function in Excel. In cell G2, I used the following formula:
=DB($B$1, $B$2, $B$3, E2, $B$4)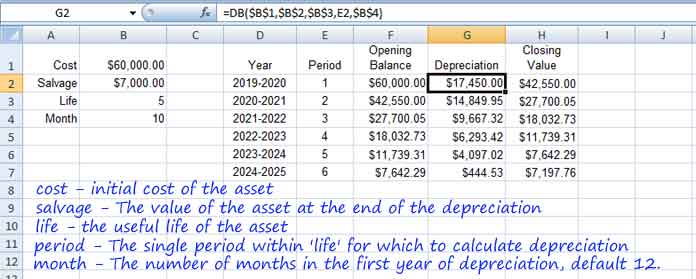
In this formula, the cell references B1, B2, B3, and B4 correspond to the cost of the asset, salvage (scrap) value, the useful life of the asset, and the number of months in the first year, respectively.
Since these references are absolute, they remain constant when you drag the formula down. The cell E2, which refers to ‘period,’ is relative, so when you drag the formula down, the value changes from 1 to 2, 3, and so on.
This approach allows the formula to return the depreciation amount for different periods in column G.
DB in Excel vs. DB in Google Sheets: Formula Comparison
Now, let’s see how the DB formula in Excel differs from that in Google Sheets using the same sample data.
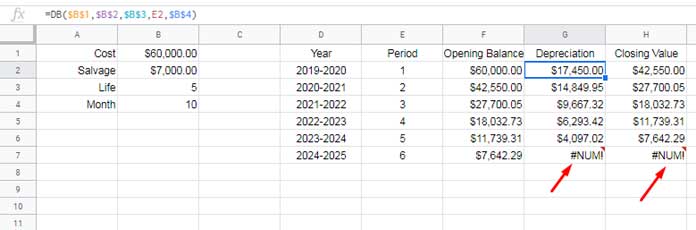
You might notice a #NUM! error in cells G7 and H7 in Google Sheets. Hover over the error to view the tooltip. This error arises because the ‘period’ parameter (cell E7) is set to 6, while the useful life of the asset is only 5 years. Therefore, the period value should be less than or equal to the life parameter.
So, why does Excel not return an error in this case?
DB Generic Formula in Excel and Google Sheets
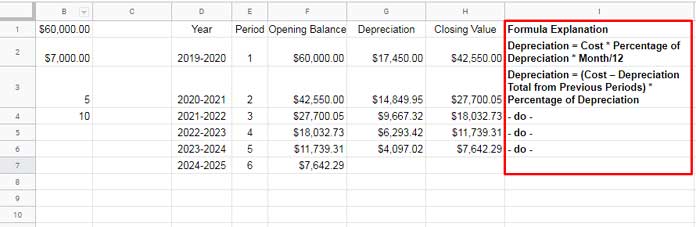
Excel and Google Sheets calculate the DB for all periods, except the first, using the following formula:
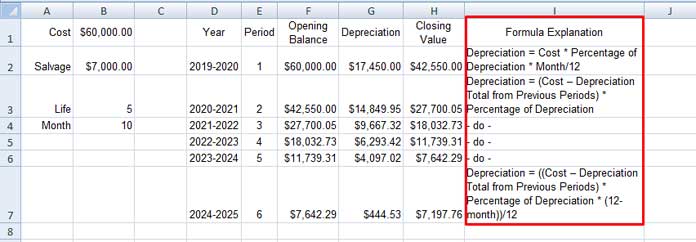
Depreciation = (Cost – Depreciation Total from Previous Periods) * Percentage of DepreciationThe Percentage of Depreciation is calculated as follows:
Percentage of Depreciation = 1 – ((salvage / initial cost) ^ (1 / life))This value must be rounded to three decimal places.
For the first period, both Excel and Google Sheets use this formula:
Depreciation = Cost * Percentage of Depreciation * (Month / 12)For the last additional period, which is the total period plus one, Excel uses the following formula:
Depreciation = (Cost * Percentage of Depreciation * (12 - Month)) / 12Manual Calculation of DB for All Periods in Google Sheets:
Manual Calculation of DB for All Periods in Excel:
I hope you find this comparison of the DB function in Excel versus Google Sheets helpful. Understanding these differences is crucial if you’re transitioning from one platform to another.


