We can fill empty cells with 0 in the interactive Pivot Tables created using the Pivot table tool in Google Sheets.
Currently, there is no option within the Pivot table editor panel to achieve this. Even using a custom formula in the calculated field, instead of the built-in aggregation functions in the Pivot table, won’t make it possible.
However, you can achieve this with a formula and its generated results. Copy-paste the result generated using that formula at the bottom of your Pivot table source data.
This process will automatically fill empty cells with 0 in your Pivot table in Google Sheets.
Before we get started, it’s important to understand why the Pivot table has blank cells instead of zero.
An empty cell indicates no data at that specific point in time. If there is data, even if it’s simply 0, you will see 0 instead of an empty cell. Automatically filling empty cells with 0 in the Pivot tool could be misleading, especially when the Pivot table data is used for decision-making.
In my personal opinion, a feature similar to Excel’s ability to fill empty cells with 0 in Pivot tables would be beneficial in Google Sheets.
Until such a feature is available, let’s proceed with my workaround that will help you fill empty cells with 0 in the Pivot table.
A Step-by-Step Guide to Filling Empty Cells with 0 in Google Sheets Pivot Tables
Consider the sample data in the range A1:C and the adjacent Pivot table.
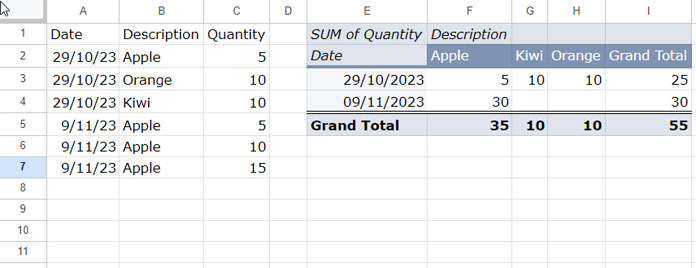
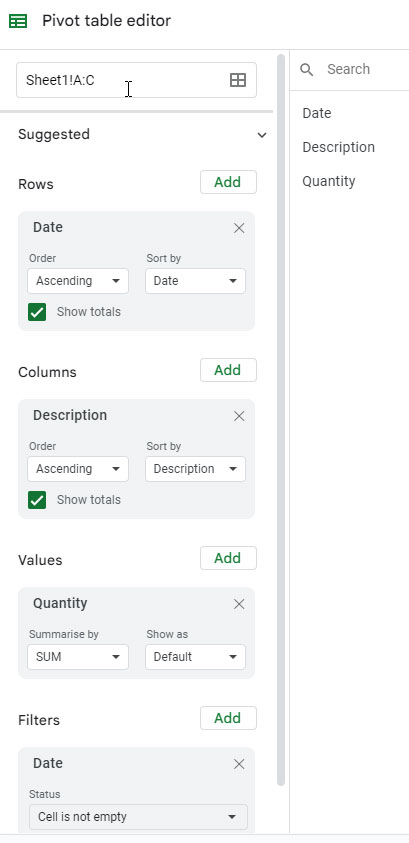
Here are the steps I’ve followed to create that Pivot table for our testing purpose:
- Select A1:C.
- Click on Insert > Pivot table.
- Check “Existing sheet,” enter E1, and click the Create button.
- Within the Pivot table editor panel, add “Date” under the Rows grouping and “Description” under the Columns grouping. Place “Quantity” below Values.
- Under Filter, add “Date” and choose Filter by Condition > Is not empty.
- Click the OK button.
The Pivot table is ready.
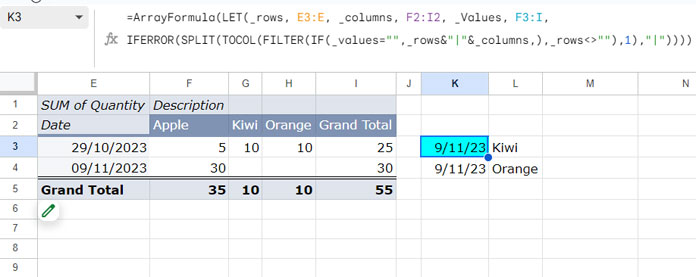
According to the sample data, we purchased Apple, Orange, and Kiwi on 29/10/2023, and Apple again on 09/11/2023. Consequently, in the pivot table, the cells under Kiwi and Orange are empty for the date 09/11/2023.
This absence of records for Kiwi and Orange on 09/11/2023 indicates that there are no entries for these fruits on that specific date. If there were two records with a quantity of 0, the corresponding cell would automatically be filled with 0. Take note of that.
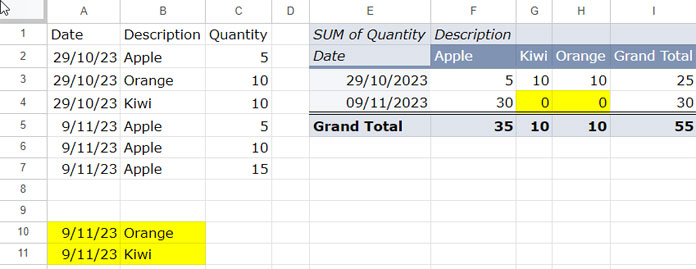
How can we identify and generate these records to add them below the source data?
We will depend on a formula for this purpose.
Formula to Find Missing Records in Google Sheets Pivot Tables
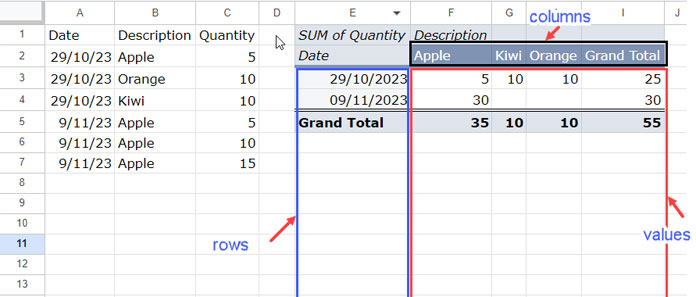
We’ll create the formula using the Pivot table rather than the source data. It requires three fields similar to the Pivot Table: Rows, Columns, and Values.
The corresponding ranges in the Pivot Table are E3:E4 (Rows), F2:I2 (Columns), and F3:I4 (Values).
As the Pivot table can expand when more records are added to the source data, using the above range in a formula will make it less flexible.
Therefore, we will open the ranges vertically. E3:E4 becomes E3:E, and F3:I4 becomes F3:I in the formula.
Here’s the formula:
=ArrayFormula(LET(
     _rows, E3:E, _columns, F2:I2, _Values, F3:I,
     IFERROR(SPLIT(TOCOL(FILTER(
          IF(_values="",_rows&"|"&_columns,),_rows<>""),1),"|")
     )
))
Notes:
- If your values under Rows are dates, the formula will return date values. Select them (e.g., K3:K) and apply Format > Number > Date.
- In the source data, we currently have three categories: “Apple,” “Kiwi,” and “Orange.” If you add more categories to your source data, the width of the Pivot Table will increase. In such cases, manual modification of the formula is necessary.
- For example, if you introduce one more fruit, E3:E will remain E3:E, but F2:I2 will extend to F2:J2, and F3:I will become F3:J. These changes need to be done manually.
Formula Explanation
ArrayFormula: This function facilitates operations on arrays of data, causing the result to expand.
Syntax of the LET Function:
LET(name1, value_expression1, [name2, …], [value_expression2, …], formula_expression)The LET function allows you to define variables (names to values or expressions) and use them within a formula.
- name1:
_rows - value_expression1:
E3:E - name2:
_columns - value_expression2:
F2:I2 - name3:
_values - value_expression3:
F3:I
Formula_expression:
IFERROR(SPLIT(TOCOL(FILTER(IF(_values="",_rows&"|"&_columns,),_rows<>""),1),"|"))The IF function tests whether the cell value in the Pivot table is blank. If blank, it adds the corresponding date with the corresponding fruit name in the header.
The FILTER function restricts the formula results to the last row in the Pivot table by filtering out empty rows.
TOCOL arranges the result into a single column, removing empty cells in the process. The SPLIT function separates dates and fruit names.
This process generates records for copy-pasting below the source data, effectively filling empty cells with blanks in the Pivot table. Please find the details below.
Final Step: Fill Empty Cells with 0 in Your Google Sheets Pivot Table
If you scroll up and check the range used for creating the Pivot table, you can see that it’s A:C, covering an open range.
What you need to do is copy the above formula results and paste them as values somewhere below your source data. Leave some blank rows between your original data and this ‘fake’ data.
The dates (Rows) must go under column A, and the fruit names (Columns) must go under column B. This will bring about two changes:
- It will fill the empty cells with 0 in the Pivot table.
- The formula result will become blank.
To paste the copied data as values, follow these steps:
- Right-click on the destination where you want to paste the data.
- Hover over “Paste special” in the context menu.
- Choose “Paste values only.”
Conclusion
I understand that having another example can help you better grasp how to apply the formula to your sheet. To assist you, I’m sharing my sample sheet below, featuring two pivot tables.
I haven’t populated the formula results below the source data yet. Consequently, the Pivot tables will still display empty cells. Follow the provided instructions to copy-paste the results and fill those empty cells with 0 in the Pivot tables.
Related: Replace Blank Cells with 0 in Query Pivot in Google Sheets.


