To count unique dates in a date range, we may first think about the function COUNTUNIQUE. But it’s not the correct function. Why?
We can’t depend on COUNTUNIQUE to count unique dates in a date range. Because it can’t handle conditions. So what are the options?
In this tutorial, you are going to get five formulas for the said purpose. They are of different types such as;
- 1 database formula (also a combo formula).
- 3 combo formulas.
- 1 standalone formula.
The database formula is based on the database function DCOUNT and the filter category function called UNIQUE whereas the standalone formula is based on COUNTUNIQUEIFS.
Other than the above, there are three combo formulas that also we can use to count unique dates in a date range in Google Sheets.
Here are the 5 formula options for ‘countunique’ a date range in Google Sheets.
Date Range Sample and Criteria for the Test

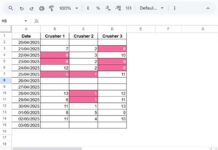
The dates to count are in A3:A17. The criteria (date range) are in C2 and D2.
What I want is to count the unique dates between the dates 01/11/2020 and 10/11/2020.
Please note that all the dates in my example are in DD/MM/YY format.
The result of the unique count will be 6. Those dates are highlighted in the image to make you easily understand.
Let’s go to the formulas one by one. I am starting with the Database combo formula.
Dcount to Count Unique Dates in a Date Range
Must Read: How to Use Dcount, Dcounta Functions in Google Sheets.
First, I’ll not use the criteria which are in cells C2 and D2. I’m going to hardcode them into the formula.
Function Syntax: DCOUNT(database, field, criteria)
Formula:
=dcount(
     unique(A2:A17),
     1,
     {{"Date";">="&date(2020,11,1)},{"Date";"<="&date(2020,11,10)}}
)
In the above formula, the formula part unique(A2:A17) is the so-called ‘database’ argument in the Dcount. The UNIQUE returns a unique date range as per the below table.
| date |
| 1/11/20 |
| 2/11/20 |
| 5/11/20 |
| 6/11/20 |
| 8/11/20 |
| 9/11/20 |
| 11/11/20 |
The ‘field’ number is 1. It’s the relative position of the date column in the ‘database’. As you may know, there is only one column in our sample data.
Now we need to apply the ‘criteria’ part.
If you have gone through my guide titled – The Ultimate Guide to Using Criteria in Database Functions in Google Sheets – you could understand the usage of date criteria or any other criteria as an array in Database functions in Google Sheets.
Here that criteria array is;
{{"Date";">="&date(2020,11,1)},{"Date";"<="&date(2020,11,10)}}This way, we can use DCOUNT to count unique dates in a date range in Google Sheets.
I want to use the criteria outside the formula, which are in cells C2 and D2. How to use them?
For that, you need to insert the ‘field’ label, i.e., “date” both in the cells C1 and D1. Because it’s the field label in A2, and we must use the same in the criteria.
After that, change the C2 date from 1/11/20 to >=1/11/20 and D2 date from 10/11/20 to <=10/11/20.
Then you can use the DCOUNT formula as below.
=dcount(
     unique(A2:A17),
     1,
     G1:H2
)
So simple, right?
COUNTUNIQUEIFS to Count Unique Dates in a Date Range
Must Read: How to Use the COUNTUNIQUEIFS Function in Google Sheets.
Here is my second preference to count unique dates in a date range column. Unlike the Countunique function, it can handle criteria.
Syntax: COUNTUNIQUEIFS(range, criteria_range1, criterion1, [criteria_range2, …], [criterion2, …])
Here in the below Countuniqueifs formula, the criteria (dates) are hardcoded (directly inserted within the formula, not used as cell references).
=COUNTUNIQUEIFS(
     A3:A17,
     A3:A17,
     ">="&date(2020,11,1),A3:A17,"<="&date(2020,11,10)
)
Similar to DCOUNT, we can make this formula more simple by specifying the criteria as variables (cell references).
=COUNTUNIQUEIFS(
     A3:A17,
     A3:A17,">="&C2,A3:A17,"<="&D2
)
Note: Tips to Choose Between DCOUNT and COUNTUNIQUEIFS.
If your dates in column a contain a header row (see the cell A2), then you can use DCOUNT as it’s a database function.
I mean, the date range should have the characteristics of a database.
If it’s just a range, then use Countuniqueifs.
3 Combo Formulas (Additional Tips)
Combo Formula 1 – Query
Other than the above two formulas, we can use three more different formulas to count unique dates in a date range in Google Sheets.
They include Query, Filter and Countifs.
I will start with the Query. In Query also we should use the Unique in the Query ‘Data’.
Query Syntax: QUERY(data, query, [headers])
Formula:
=query(
     unique(A3:A17),
     "Select Count(Col1) where Col1>=date '2020-11-1' and Col1<=date '2020-11-10' label Count(Col1)''"
)
The date criteria are hardcoded in Query. If we refer the cells C2 and D2, then the formula would be as follows.
=query(
     unique(A3:A17),
     "Select Count(Col1) where Col1>=date '"&TEXT(C2,"yyyy-mm-dd")&"' and Col1<=date '"&TEXT(D2,"yyyy-mm-dd")&"' label Count(Col1)''"
)
Here you should note one important thing.
Whatever the date format in your sheet, in the formula, you should follow the same date format that I have used in my above Query formulas.
Read More About Here: How to Use Date Criteria in Query Function in Google Sheets.
Combo Formula 2 – Filter
Compared to Query, The FILTER seems more practical here to count unique dates in a date range in Google Sheets.
Syntax: FILTER(range, condition1, [condition2, …])
Here either we can filter a unique range of dates or filter the dates as per the criterion and then Unique it. I’m following the latter.
=unique(
     filter(
        A3:A17,
        A3:A17>=date(2020,11,1),
        A3:A17<=date(2020,11,10)
     )
)
Result:
| 1/11/20 |
| 2/11/20 |
| 5/11/20 |
| 6/11/20 |
| 8/11/20 |
| 9/11/20 |
By wrapping this output with Count, we can get the required result.
How to do that?
Wrap the above Unique + Filter combo with Count. You can see the formula below.
Formula:
=count(
     unique(
        filter(
           A3:A17,
           A3:A17>=date(2020,11,1),
           A3:A17<=date(2020,11,10)
        )
     )
)
In this combo formula two also, we can refer to cells instead of inserting the criteria within the formula. Here is that.
Replace >=date(2020,11,1) with >=C2 and replace <=date(2020,11,10) with <=D2. It’s that simple!
Combo Formula 3 – Countifs
Here is the final formula to count unique dates in a date range in Google Sheets.
We can use Countif for the conditional count.
Since it doesn’t have the ‘unique’ capability (making the range unique), we can take the help of the Unique function here within Countif.
Syntax: COUNTIF(range, criterion)
Formula:
=countifs(
     unique(A3:A17),">="&date(2020,11,1),
     unique(A3:A17),"<="&date(2020,11,10)
)
Here, to replace the hardcoded criteria, replace ">="&date(2020,11,1) with ">="&C2 and "<="&date(2020,11,10) with "<="&D2.
The above are the 5 formulas to count unique dates in a date range in Google Sheets.
This way, we can count the unique dates from a start date and end date like in a month, in a year, or in a particular period like q1, q2, or q3.
Thanks for the stay. Enjoy!
Resources:

