


")


")

")
")
 in Excel & Google Sheets")


Are you looking for a way to find duplicate streaks in Google Sheets? You can use the following formula to count the consecutive occurrences of values in a dataset.
=ArrayFormula(CHOOSECOLS(QUERY(HSTACK(range, range&"|"&ROW(range)*(range<>"")-COUNTIFS(ROW(range),"<="&ROW(range), range, range), ROW(range)), "select Col1, max(Col3), count(Col2) where Col1 is not null group by Col1, Col2 order by max(Col3) label max(Col3)'', count(Col2)''"), 1, 3))Where “range” is a single-column range containing the values you want to analyze for streaks.
Purpose
Counting consecutive occurrences of values in Google Sheets helps analyze streaks or clusters of repeated values in a dataset. This technique is useful in many real-life scenarios, such as tracking consecutive absences of employees, identifying repeated product purchases, and analyzing streaks in sports or sales data.
For example, consider a student attendance sheet with dates in one column and attendance status (Present or Absent) in another column. Applying the formula to the Present/Absent column will return the count of consecutive occurrences of Present and Absent entries.
If the dates range from 01/01/2025 to 31/01/2025 (excluding weekends) and a student was absent from 20/01/2025 to 24/01/2025, the formula will return the following result:
Present    13
Absent     5
Present    5
Now, let’s look at an example using fruit data to identify repeating groups.
Example: Counting Consecutive Occurrences in Google Sheets
Assume we have the following fruit data in column B, within the range B2:B.
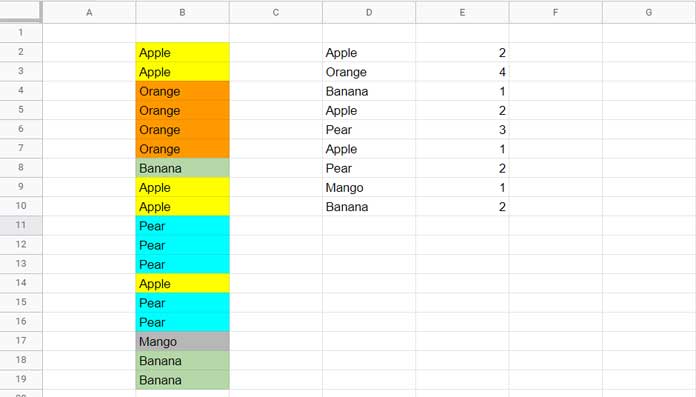
Formula to Count Consecutive Occurrences
To count consecutive occurrences of all fruits in one go, enter the following formula in D2:
=ArrayFormula(CHOOSECOLS(QUERY(HSTACK(B2:B, B2:B&"|"&ROW(B2:B)*(B2:B<>"")-COUNTIFS(ROW(B2:B),"<="&ROW(B2:B), B2:B, B2:B), ROW(B2:B)), "select Col1, max(Col3), count(Col2) where Col1 is not null group by Col1, Col2 order by max(Col3) label max(Col3)'', count(Col2)''"), 1, 3))To make the formula more readable and reusable, you can use the LET function so that the range is specified only once:
=LET(range, B2:B, ArrayFormula(CHOOSECOLS(QUERY(HSTACK(range, range&"|"&ROW(range)*(range<>"")-COUNTIFS(ROW(range),"<="&ROW(range), range, range), ROW(range)), "select Col1, max(Col3), count(Col2) where Col1 is not null group by Col1, Col2 order by max(Col3) label max(Col3)'', count(Col2)''"), 1, 3)))Formula Explanation
We use the QUERY function to calculate the consecutive occurrences of all values in Google Sheets.
Syntax:
QUERY(data, query, [headers])Data Component:
HSTACK(range, range&"|"&ROW(range)*(range<>"")-COUNTIFS(ROW(range),"<="&ROW(range),range,range), ROW(range))This dataset contains three columns:
- Actual values from the range (e.g., B2:B).
- Group IDs created using row numbers and COUNTIFS to identify repeating groups.
- Row numbers for sorting purposes.
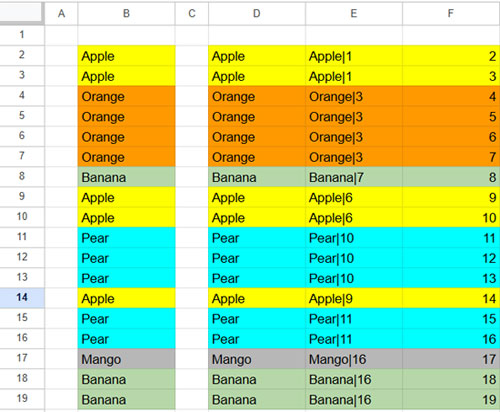
Understanding COUNTIFS:
COUNTIFS(ROW(range),"<="&ROW(range),range,range)This function generates a running count of items in column B. By subtracting row numbers, we identify repeating groups.
We then combine these repeating group IDs with the item itself, which forms the second column in the QUERY data.
Final Query Statement:
"select Col1, max(Col3), count(Col2) where Col1 is not null group by Col1, Col2 order by max(Col3) label max(Col3)'',count(Col2)''"- Selects unique items while excluding empty rows.
- Counts the number of consecutive occurrences for each value.
- Sorts results based on original row order using
max(Col3).
Conclusion
This method efficiently finds and counts consecutive occurrences of values in Google Sheets. Whether analyzing attendance, sales trends, or streaks in any dataset, this formula provides a powerful way to detect patterns.
Resources
- Convert Consecutive Dates to Date Ranges in Google Sheets: The REDUCE Method
- Highlight N Consecutive Decreases in Numeric Data in Google Sheets
- Highlight Data Spikes (Consecutive Increases) in Google Sheets
- Longest Winning and Losing Streak Formulas in Google Sheets
- Finding Current Win/Loss Streak in Google Sheets
- Winning/Losing/Tie Streaks in a Filtered Range in Google Sheets
- Excel: Dynamic Arrays for Longest & Current Winning Streak