

")
")


")


This tutorial explains how to quickly create a basic Gantt chart using the Stacked Bar chart feature in Google Sheets. Creating this chart requires inputting task names, start dates, end dates, and durations.
For additional timeline details such as remaining days, elapsed days, holidays, etc., you may need to utilize SPARKLINES or Conditional Formatting. (You can also display the remaining days in a Stacked Bar chart. Please check the ‘Resources’ section at the bottom.)
This Gantt chart is designed for basic use and lacks features such as task grouping, task linking, or setting dependencies, making it unsuitable for complex projects.
Data Formatting
Prepare the following data for creating the chart:
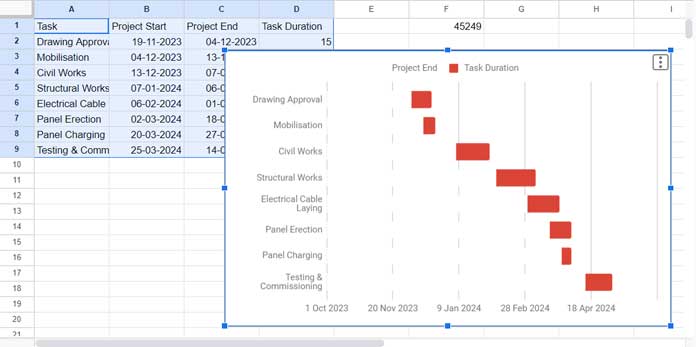
| Task | Project Start | Project End | Task Duration |
| Drawing Approval | 19-11-2023 | 04-12-2023 | 15 |
| Mobilisation | 04-12-2023 | 13-12-2023 | 9 |
| Civil Works | 13-12-2023 | 07-01-2024 | 25 |
| Structural Works | 07-01-2024 | 06-02-2024 | 30 |
| Electrical Cable Laying | 06-02-2024 | 01-03-2024 | 24 |
| Panel Erection | 02-03-2024 | 18-03-2024 | 16 |
| Panel Charging | 20-03-2024 | 27-03-2024 | 7 |
| Testing & Commissioning | 25-03-2024 | 14-04-2024 | 20 |
To prepare the data:
- Enter the above data in cells A1:C9 of an empty sheet, excluding the duration column.
- In cell D2, enter the following array formula to calculate the duration:
=ArrayFormula(DAYS(C2:C9, B2:B9)) - In cell F1, enter the following formula to obtain the date value of the earliest date among the task start and end dates:
=N(MIN(B2:C9))
This formatted data is necessary for creating the Gantt chart using the Stacked Bar chart in Google Sheets.
Steps to Create the Gantt Chart Using the Stacked Bar Chart
Select the data range A1:D9 and click Insert > Chart. Google Sheets will insert a chart, which may not be the one we want. We will modify it to meet our requirements. Here are the settings to follow:
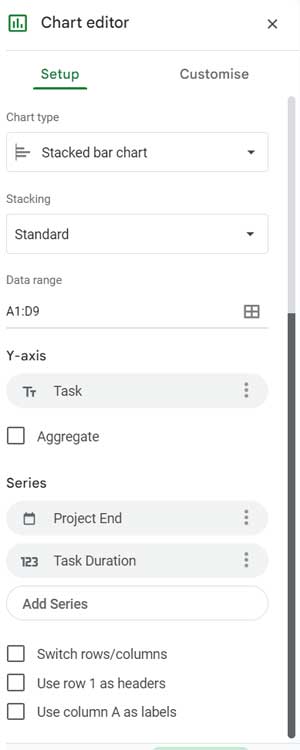
Within the Chart Editor sidebar panel, you’ll find two tabs: Setup and Customize.
Setup Tab Settings:
- Under Chart Type, select Stacked Bar chart.
- Ensure Stacking is set to Standard if it’s not already.
- Under Y-Axis, ensure that the ‘Task’ field is added. If it’s not, remove any existing Y-Axis field and add the ‘Task’ field.
- Under Series, include the fields ‘Project End’ and ‘Task Duration’. Remove any unnecessary fields, such as ‘Task Start’ if present.
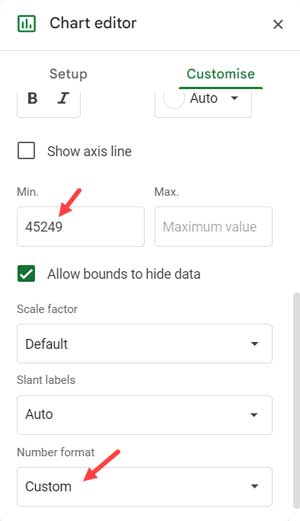
Customize Tab Settings:
- Click Series and select Project End, then change the fill color to white.
- Under the Horizontal axis, enter the value returned by the formula in cell F1 into the Min field. Then, under Number Format, select Date Time and choose your preferred date formatting.
Your basic Gantt chart is now ready.
Important Note
If you modify the project start date or end date for any task in the source data, the formula in cell F1 may return a different date value.
You will need to manually update the ‘Min’ value in the Customize tab of the chart editor. You can find this under the Horizontal axis settings (refer to the screenshot above).
Resources
We can display the remaining days for each task in the above Gantt chart (Stacked Bar chart). You can find this and other resources below.
- Create Gantt Chart Using Formulas in Google Sheets
- Create a Gantt Chart Using Sparkline in Google Sheets
- Split a Task in a Custom Gantt Chart in Google Sheets
- Multi-Color Gantt Chart in Google Sheets
- Flexible Timescale for Gantt Chart in Google Sheets
- Days Remaining in Gantt Chart in Google Sheets
- Date Filter in Gantt Chart in Google Sheets
- GANTT_CHART Function in Google Sheets (Named Function)
- Track Remaining Days in Tasks with Sparkline Gantt Charts