


Using the VARP function in Google Sheets, we can calculate the variance of an entire population.
The variance of the (whole/entire) population is usually represented by σ2.
In Google Sheets, we can calculate the variance using the following functions – DVARP, VARP, or VAR.P.
Among the three, the first one is a database function and for use in structured data. We will discuss that function in another tutorial.
The other two are statistical functions.
Why are there two statistical functions for calculating σ2 in Google Sheets?
As far as I know, the functions VAR (population sample) and VARP (entire population) are later replaced by VAR.S and VAR.P, respectively. The program keeps the older ones for backward compatibility.
But, even if you use the function VAR.P in a formula in Google Sheets and when you hit enter, it automatically switches to VARP.
So, you can use either of the VAR.P or VARP functions in Google Sheets for the variance calculation of an entire population. The result will be the same.
VARP Function in Google Sheets – Syntax and Arguments
Syntax # 1:
VARP(value1, value2, …)Syntax # 2:
VAR.P(value1, value2, …)Arguments:-
The functions have the following arguments in their syntax.
value1 – The first value or array/range of the population.
value2, … – Additional values or arrays/ranges to include in the population.
Formula Example to the VARP Function in Google Sheets
Let’s see how to find the population variance of the age of members in a group of seven members.
We can use the below formula when the values are arranged in the array B4:B10.
=VARP(B4:B10)σ2 = 21.71
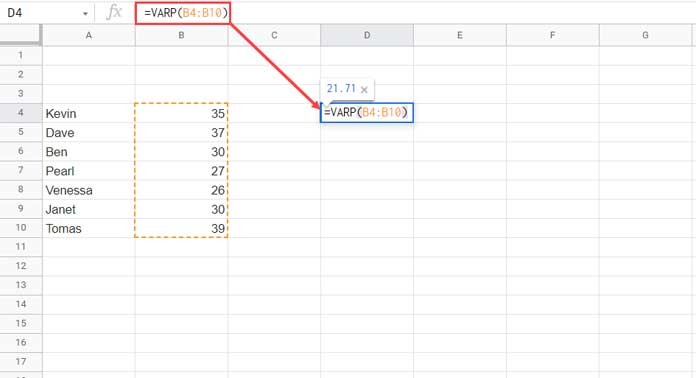
We can use the VARP function as above in Google Sheets for the variance calculation of an entire population.
Analyzing the Variance Result and the Calculation Behind
The below points have nothing to do with the formula above. It’s just to make you clearly understand the population variance.
First of all, let’s go to the result analysis.
- A large σ2 shows the ages of members in the dataset are far from their average age and far from each other.
- A small σ2 points out the opposite of the above.
- If the σ2 value is zero, it indicates that all the values within the dataset are identical.
Understanding the Calculation:-
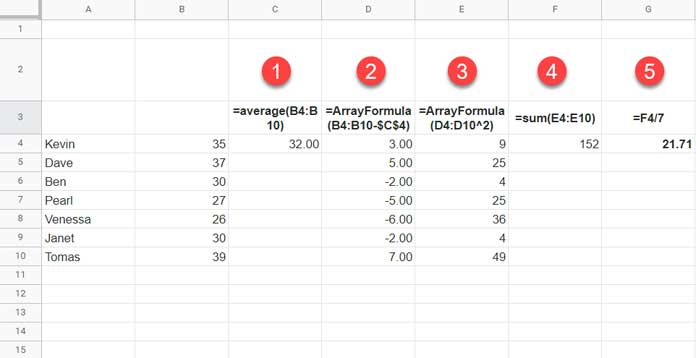
We can calculate the variance of an entire population in five steps.
Since I am applying these steps in a Sheet, I have used formulas (in C4:G4), and you can find them next to each step below.
- Find the average:
=average(B4:B10) - Subtract each data point from the mean:
=ArrayFormula(B4:B10-$C$4) - Square the step # 2 results:
=ArrayFormula(D4:D10^2) - Add up step # 3 results:
=sum(E4:E10) - Finally, divide step # 4 result by the number of items, and that is the variance:
=F4/7
Points to Be Noted
There may be blank cells, numbers formatted as text, strings, logical values, etc., within the specified range in the formula.
Let’s see how such values affect the VARP function in Google Sheets.
- Empty cells, text strings, or Boolean TRUE/FALSE values in the reference range/array are ignored.
- In case of error values in the specified range, the formula returns the first error value as the output. For example, if cell B6 contains #N/A and B7 contains #DIV/0, the VARP function will return #N/A.
Contrary to the above, when you hardcode the values within the formula, it will consider blanks and Boolean values in the evaluation.
See the below two formulas. Their result won’t be the same.
Formula # 1:
=varp(35,37,true,27,,26,30,39)Formula # 2:
=varp(35,37,27,26,30,39)That’s all about the VAR.P/VARP function in Google Sheets.
Thanks for the stay. Enjoy!