


")


")

")
")
 in Excel & Google Sheets")


To sort by number of occurrences in Google Sheets, you can use two different methods. One involves the Sort range option from the Data menu, and the other uses the SORT function.
The first method modifies the existing range but needs a helper column. The second method — using the SORT function — returns the result in a new range without needing a helper column.
Which one would you go with?
Either way, in this post, you’ll learn both methods to sort a list by frequency in Google Sheets — that is, to sort items based on how often they appear in a dataset.
Where Do These Types of Sorting Come in Handy?
Let me start by saying: these types of sorting aren’t typically used in summary reports. But here’s a real-world scenario where sorting by number of occurrences in Google Sheets is incredibly useful.
The Scenario and Sample Data
Let’s say you sell various items, and each sale is logged in a Google Sheet. If you sort the items or product IDs by how often they appear, you’ll instantly see which ones sell most frequently — which may not necessarily be your top-selling items by revenue, but still valuable insight.
Here’s a relatable example from real life: transporting crusher products like sand and gravel in trucks with a fixed capacity — say 45 m³.
If you sort the truck numbers by frequency of trips, you’ll see which trucks are used the most.
Similarly, sorting the items (like sand or gravel) by frequency will reveal your most frequently moved or sold products.
Tip: Switch the sort order from descending (Z–A) to ascending (A–Z) to highlight the least-used trucks or least-sold items.
The best part? You can sort by number of occurrences in Google Sheets using just the SORT function — no separate column for frequency required.
Sample Data – Crusher Products
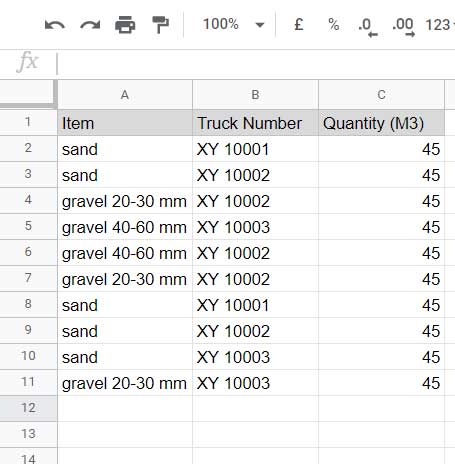
Here’s a sample dataset showing the transportation of sand and gravel in 45 m³ trucks.
Formula to Sort by Number of Occurrences in Google Sheets
Our sample data is in the range A1:C11, with three columns: Item, Truck Number, and Quantity.
Since the dataset might grow, we’ll use A1:C as our range in the formulas to make them dynamic.
Simply sorting the “Item” or “Truck Number” column isn’t enough. We need to sort the entire dataset based on how often each value appears.
Let’s look at the two formulas.
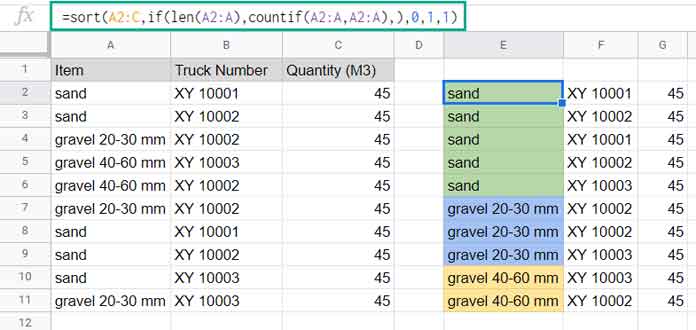
Formula #1 (in Cell E2)
Sort the list in A2:C by the number of occurrences of “Items”:
=SORT(
     A2:C,
     IF(LEN(A2:A), COUNTIF(A2:A, A2:A), ),
     0,
     1,
     1
)
This will sort items by number of occurrences in Google Sheets, showing the most frequent ones at the top.
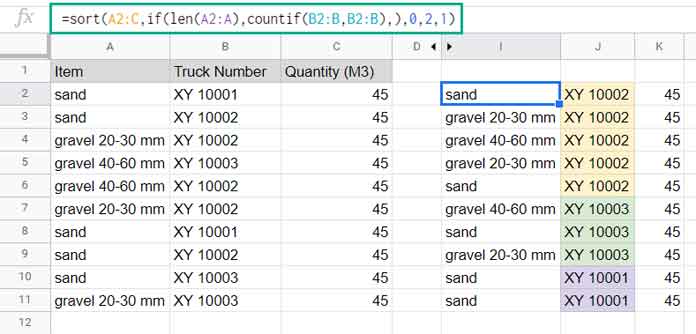
Formula #2 (in Cell I2)
Sort the list in A2:C by the number of occurrences of “Truck Numbers”:
=SORT(
     A2:C,
     IF(LEN(A2:A), COUNTIF(B2:B, B2:B), ),
     0,
     2,
     1
)
This one helps you sort truck numbers by frequency in Google Sheets.
Formula Explanation
Let’s break down what’s happening in both formulas.
Understanding Formula #1 – COUNTIF Logic
IF(LEN(A2:A), COUNTIF(A2:A, A2:A), )This part calculates how many times each item appears in the “Item” column (A2:A).
Understanding Formula #2 – COUNTIF Logic
IF(LEN(A2:A), COUNTIF(B2:B, B2:B), )Same logic, but this time we’re counting occurrences of truck numbers in column B.
If you try just this portion of the formula in a single cell (e.g., D2), it may return only one value because IF and COUNTIF are not array functions on their own.
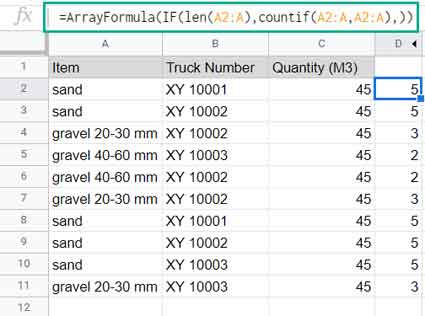
To test it properly, wrap it with ArrayFormula:
=ArrayFormula(
     IF(LEN(A2:A), COUNTIF(A2:A, A2:A), )
)
This version will correctly return the frequency of items (or truck numbers) down the column.
In our earlier formulas, since SORT is an array formula, it automatically expands the result from COUNTIF.
Let’s Revisit the First Formula:
=SORT(
     A2:C,
     IF(LEN(A2:A), COUNTIF(A2:A, A2:A), ),
     0,
     1,
     1
)
Now here’s how it aligns with the SORT function syntax:
SORT(range, sort_column, is_ascending, [sort_column2], [is_ascending2])Explanation:
range: A2:C — the datasetsort_column: theCOUNTIFlogic — returns frequencyis_ascending: 0 — descending (most frequent first)sort_column2: 1 — the item columnis_ascending2: 1 — ascending (optional tie-breaker)
In Formula #2, the logic is identical but applied to truck numbers.
Sort by Frequency in Google Sheets Using the Sort Menu
Want to sort without writing complex formulas? Let’s use the Sort menu with a helper column.
We’ll stick with the same sample data in range A2:C.
Step 1: Insert the helper formula in cell D2
=ArrayFormula(
     IF(LEN(A2:A), COUNTIF(A2:A, A2:A), )
)
Step 2: Select A2:D11 and Apply Sorting via the Data Menu
Data > Sort range > Advanced range sorting options
Sort by Column D (helper) in Z → A order.
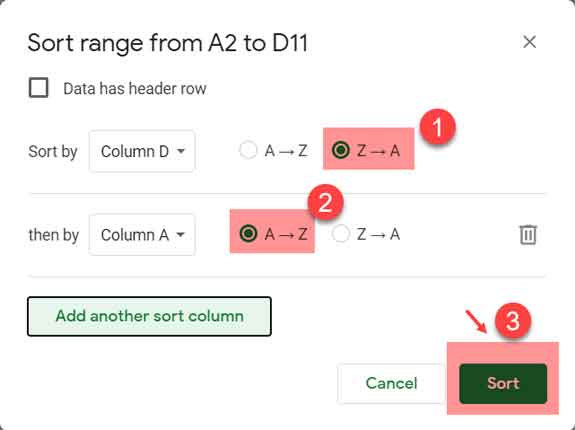
Done! You’ve just learned to sort by frequency in Google Sheets using the menu option.
Final Thoughts
And that’s how you can sort by number of occurrences in Google Sheets — whether using formulas or the menu.
Both methods are easy to implement, depending on your preference. Use it to find your most used trucks, most frequent products, or anything else that appears repeatedly in your dataset.
Thanks for sticking around. Enjoy!
Related Resources
- Count and Filter Most Frequent Strings in Google Sheets
- Highlight Duplicate Values Based on Occurrence Days in Google Sheets
- Count Consecutive Occurrences of Values in Google Sheets
- Sort by Custom Order in Google Sheets [How to Guide]
- How to Rank Group Wise in Google Sheets
- Sort Data in Google Sheets: SORT vs. QUERY vs. SORTN
- Fix Array Formula Messing Up When Sorting in Google Sheets
- Sort by Day of Week in Google Sheets
- Sort Column by Length of Text in Google Sheets