The GETPIVOTDATA function in Google Sheets is specifically designed for those who use Pivot Tables to create summary reports and charts.
If you frequently use Pivot Tables in Google Sheets, learning how to use this function can be quite beneficial.
The purpose of the GETPIVOTDATA function is clear from its name—it allows you to retrieve data from a Pivot Table. In other words, it helps extract aggregated information from a Pivot Table report.
For example, if your Pivot Table range is A1:D12, you could directly reference the aggregated value in C11 using =C11. However, this is not the ideal approach. Do you know why?
When the layout of the Pivot Table changes due to modifications in the source data, those changes might not be reflected in the directly referenced value. This is where the GETPIVOTDATA function becomes invaluable.
You can use the formula like this:
=GETPIVOTDATA("SUM of Marks", A1, "Name", "Student 2")This formula extracts the “SUM of Marks” (aggregated value) for “Student 2” from the Pivot Table starting at cell A1. The data is grouped by the “Name” column, with “Student 2” being one of the names in that column.
GETPIVOTDATA Function: Syntax and Arguments (With Illustration)
Let’s begin with the syntax of the function. It may seem confusing to some users, but I’ve provided clear explanations to simplify it.
Syntax:
GETPIVOTDATA(value_name, any_pivot_table_cell, [original_column, …], [pivot_item, …])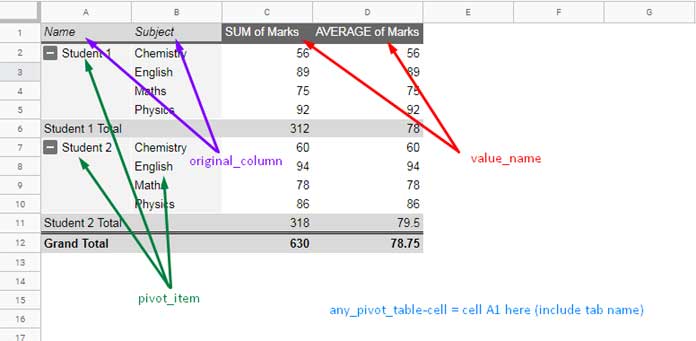
Arguments:
value_name: The name of the value, or the field label of the aggregated column in the Pivot Table, for which you want to retrieve data.any_pivot_table_cell: A reference to any cell within the desired Pivot Table. It’s recommended to use the very first cell in your Pivot Table so that any shrinking or expansion of the table does not affect the reference.original_column: The name of the column (field label) in the source data set used for grouping.pivot_item: The item in theoriginal_columnwithin the Pivot Table for which you want to retrieve the aggregated value.
In layman’s terms, when using the GETPIVOTDATA function, first specify the label of the aggregated column in the Pivot Table, then reference the first cell in the Pivot Table. Next, specify the grouped column label and item from the source data, followed by the second grouped column label and item, if applicable.
value_name, original_column, and pivot_item can be specified as a cell reference or hardcoded (entered directly) in the formula. Be mindful when pivot_item is a date—it should be formatted exactly as it appears within the Pivot Table, for example, TEXT(DATE(2024, 10, 30), "DD/MM/YYYY") or TEXT(A100, "DD/MM/YYYY").
Creating a Sample Pivot Table
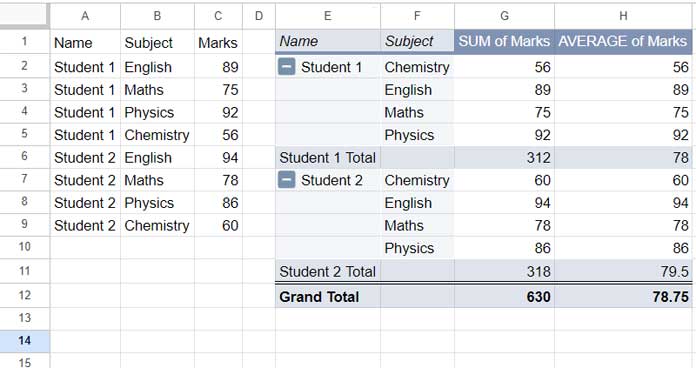
Enter or copy-paste the following data into cells A1:C9 of a new sheet.
| Name | Subject | Marks |
| Student 1 | English | 89 |
| Student 1 | Maths | 75 |
| Student 1 | Physics | 92 |
| Student 1 | Chemistry | 56 |
| Student 2 | English | 94 |
| Student 2 | Maths | 78 |
| Student 2 | Physics | 86 |
| Student 2 | Chemistry | 60 |
To create a Pivot Table for learning the GETPIVOTDATA function, follow these steps:
- Select cells A1:C9.
- Click Insert > Pivot Table.
- Choose Existing Sheet.
- Enter
E1in the field immediately below the above option. - Click Create.
In the Pivot Table editor panel on the sidebar:
- Drag and drop Name and Subject under Rows.
- Drag and drop Marks twice under Values—one for Sum and the other for Average.
You will get a Pivot Table similar to the one shown below. Let’s use the GETPIVOTDATA function with this report.
Code Your First GETPIVOTDATA Formula: Step-by-Step
Parameter 1: value_name
In this Pivot Table, there are two value names: “SUM of Marks” and “AVERAGE of Marks.”
Let’s use “SUM of Marks” to retrieve a value from this Pivot Table column. The formula starts as:
=GETPIVOTDATA("SUM of Marks",Parameter 2: any_pivot_table_cell
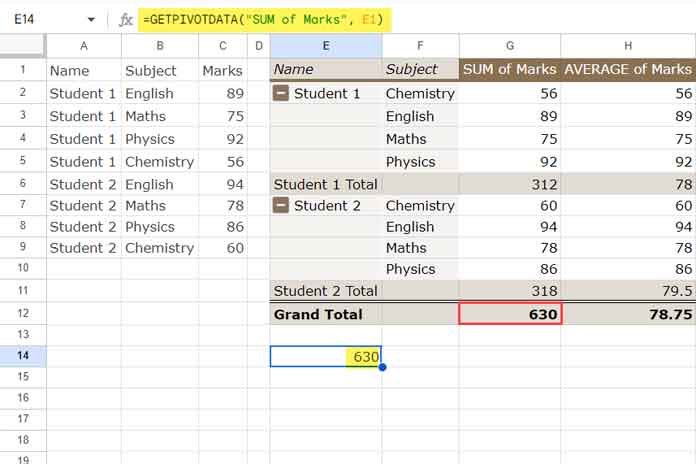
Specify the first cell of the Pivot Table, which is E1:
=GETPIVOTDATA("SUM of Marks", E1)You can close the bracket here since the other arguments are optional. The formula will return the total marks of students, which is 630.
Parameter 3: original_column
This should be the first column used for grouping, which contains the student names. The field label of this column in the source data is “Name”:
=GETPIVOTDATA("SUM of Marks", E1, "Name",Parameter 4: pivot_item
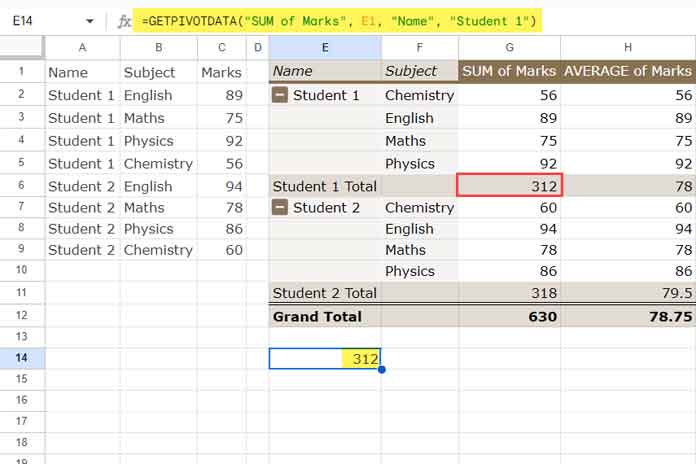
There are two items under “Name”: “Student 1” and “Student 2.” To get the total marks for “Student 1,” specify it:
=GETPIVOTDATA("SUM of Marks", E1, "Name", "Student 1")This will return the total marks for Student 1, which is 312.
We can add one more level by specifying the second column in the grouping and the corresponding value. Here’s how:
=GETPIVOTDATA("SUM of Marks", E1, "Name", "Student 1", "Subject", "Physics")This will return the marks for Student 1 in Physics.
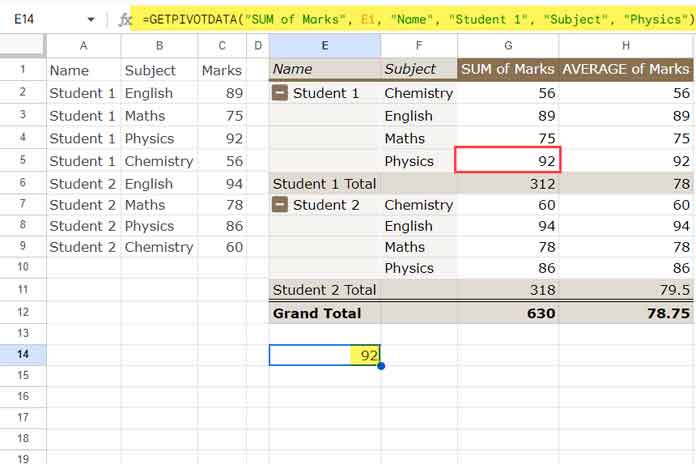
This is how you can use the GETPIVOTDATA function in Google Sheets.
GETPIVOTDATA Function and Row and Column Grouping
We have grouped the data by names and subjects using row grouping in the Pivot Table. Therefore, the original_column argument in all the GETPIVOTDATA function examples above comes from these row groups.
If you create a Pivot Table from the sample data with “Names” under “Rows” and “Subject” under “Columns,” you might find it confusing to use the GETPIVOTDATA function.
However, the formulas will not change. You should use the first original_column from the “Rows” grouping, which is the “Name” column, and the second original_column from the “Columns” grouping, which is the “Subject” column.
So, the formulas will remain the same as described above.


What if I want to get the total Physics score without changing the group order?
The formula:
=GETPIVOTDATA("SUM of Marks", E1, "Subject", "Physics")returns a
#REF!error.It works correctly when I switch Subject as the first group and Student as the second. However, I need both the total score by student and the total score by subject. Does this mean I need to create two separate pivot tables?
You can try this formula:
=GETPIVOTDATA("SUM of Marks", E1, "Name", "Student 1", "Subject", "Physics")+GETPIVOTDATA("SUM of Marks", E1, "Name", "Student 2", "Subject", "Physics")Or, you can use this native SUMIF formula:
=SUMIF(F:F, "Physics", G:G)Thanks for the tips! Since my data contains many instances of ‘student,’ another pivot table might be a better option. However, the SUMIF formula you provided is fantastic—it allows me to use SUMIF directly on the original data. I never considered this simple yet powerful approach because I was too focused on GETPIVOTDATA! 😀