")
")


")


")

")
")
 in Excel & Google Sheets")


The FORECAST or FORECAST.LINEAR function in Google Sheets helps users predict a future value based on historical data.
To find multiple future values, you can use the TREND function. While TREND can also predict a single future value, it is generally more efficient for predicting multiple future values.
FORECAST is often simpler to use for predicting a single future value. However, it can predict multiple future values when used with ARRAYFORMULA.
The TREND and FORECAST functions use the Least Squares method to determine the linear regression line, ensuring accurate predictions. As a result, the output of both functions is identical.
Linear regression is a statistical technique used to understand how a dependent variable (commonly represented as y) is related to one or more independent variables (represented as x).
FORECAST Function: Syntax and Example Formulas
Syntax:
FORECAST(x, data_y, data_x)Note: There is also a new function called FORECAST.LINEAR, which has the same syntax as FORECAST. Google Sheets introduced this new function to ensure compatibility with other spreadsheet applications that use it in their newer versions.
FORECAST.LINEAR(x, data_y, data_x)Whenever I refer to FORECAST, you can assume it’s the same as FORECAST.LINEAR.
Arguments:
You can easily understand the arguments of the FORECAST function with the help of a sample dataset. Let’s consider the following sample data in the range A1:B:
| A | B |
| Month | Sales |
| 1/1/2018 | 6 |
| 1/2/2018 | 7.5 |
| 1/3/2018 | 8 |
| 1/4/2018 | 9 |
| 1/5/2018 | 8.2 |
| 1/6/2018 | 11.5 |
| 1/7/2018 | 13.45 |
| 1/8/2018 | 16 |
| 1/9/2018 | 17.05 |
| 1/10/2018 | [Value to be forecasted] |
x: The value on the x-axis to forecast. In this example, we want to forecast the value for October, soxis A11.data_y: The y-axis values from the historical data, which is the range B2:B10.data_x: The x-axis values from the historical data, which is the range A2:A10.
The formula to find the expected y-value for October will be:
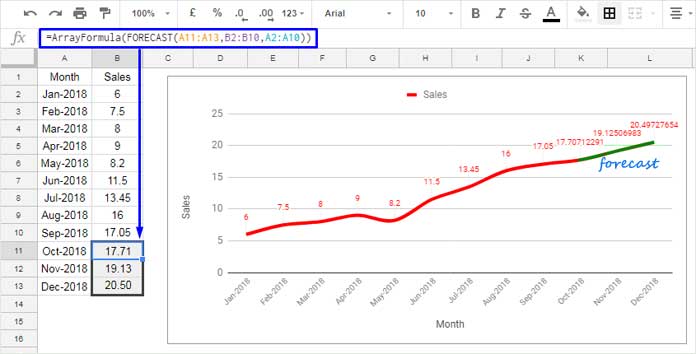
=FORECAST(A11, B2:B10, A2:A10) // returns 17.71Array Formula Usage
To forecast future y-values for October, November, and December, you can use the FORECAST function as an array formula:
=ARRAYFORMULA(FORECAST(A11:A13, $B$2:B10, $A$2:A10))Assume A11, A12, and A13 contain 1/10/2018, 1/11/2018, and 1/12/2018, respectively.
However, I recommend using the TREND function as follows:
=TREND(B2:B10, A2:A10, A11:A13)Syntax:
TREND(known_data_y, [known_data_x], [new_data_x], [b])
Real-life Example of the FORECAST Function in Google Sheets
In the following example, we use the FORECAST function with time-based (historical) data, such as past sales over a period, to predict future sales.
The sample data is the same as before: the first column contains month start dates from January to December, and the second column contains sales data from January to September. In this case, we labeled the third column as ‘Predicted.’
In cell C11, insert the following FORECAST formula and drag it down to C13:
=FORECAST(A11, $B$2:$B$10, $A$2:$A$10)
Let’s create a column chart using this data.
To create the chart, select A1:C13 and click Insert > Chart. In the Chart Editor sidebar, choose ‘Column’ as the chart type.
The blue horizontal bars represent historical sales data, while the red bars represent the forecasted data.
That concludes the explanation of the FORECAST function in Google Sheets.
Hello, I’m looking for sequence prediction. How can I use this for that?