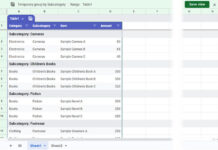
It’s not easy to conditionally format a group of items in Google Sheets. There are different types of conditional formatting available. There is no inbuilt option to conditional format based on a group of data in Google Sheets. You require a custom formula to do this and also an additional column is required which you can hide from view.
In the below example Column A contains data in different groups. Actually, it’s a sorted column. Column C is the additional column called helper column, that contains a custom formula. You can hide this column after applying conditional formatting.

In my opinion, all spreadsheet users should make the maximum benefit of conditional formatting. It can visually make your sheet stand out. You may feel more comfortable on a neatly formatted spreadsheet.
In the above conditional formatting, the color of the row changes when the value changes in Column A. The color settings are applied to a group not a single row. If you want to highlight a single row when value changes in that row, there is another tutorial from me.
Similar: Highlight Rows When Value Changes in Any Column
Actually, the above settings can apply to an entire row and I did so. Since there is only one column with the value in my sample sheet, I’ve just limited the coloring to that particular column. Now see the steps.
How to Conditional Format Based on Group of Data in Google Sheets
Here I want alternate colors for a group of rows in column A.
Step 1:
Manually put the value 0 in Cell C1. You can refer to the above screenshot.
Step 2:
Apply the below formula in Cell C2.
=IF(A2=A1,C1,C1+1)
Use the fill handle to drag this formula up to the cell where you want the formatting to apply. In my example the last cell is C12. The formula in Cell C12 would be as follows.
=IF(A12=A11,C11,C11+1)
Step 3:
It’s time to set the conditional formatting rules. To do that, go to the menu Format > Conditional formatting.
Apply the below Group wise color formatting settings.

My data range is A2: A12. You can change this as per your data range like A2: H20. As you can see I’ve used the below formula in the custom formula field.
=ISEVEN($C2)
This conditional format setting will apply Cyan color to the Rows wherever value in that row in Column C is even number. Click “Done” to finish the group-wise conditional formatting in Google Sheets.
Click the “Add another rule button” and put the following formula in the custom formula field (it’s optional)
=ISODD($C2)
This’s for Odd numbers in Column C. Here I’ve chosen the Light Red Berry color. That’s it. Follow the above steps to apply conditional format based on Group of Data in Google Sheets. Enjoy!


It goes directly to my cheat sheet! Thank you, Prashanth and Marc.
When I used Marc’s formula instead (simply editing the existing conditional formatting) then it worked as expected.
It works, but it’s overly complicated. You can accomplish this, without adding a helper column, and with just one conditional formatting formula:
=iseven(match($A1,unique($A$1:$A),0))This will mark the “even” part; already highlighting the wanted rows.
If you want the “odd” part in a specified color, add:
=isodd(match($A1,unique($A$1:$A),0))That is beautiful. Thank You!