")
")


")


")

")
")
 in Excel & Google Sheets")


To calculate the standard deviation of an entire population (σ), not a sample, we can use the STDEVP or STDEV.P function in Google Sheets.
Earlier, we looked at the STDEV (or STDEV.S) function. That function is meant for calculating the standard deviation of a sample, not an entire population. The difference is important!
As mentioned at the beginning, there are two functions available for this purpose—STDEVP and STDEV.P. Both are used to calculate the standard deviation of an entire population. Similarly, we have STDEV and STDEV.S for calculating the standard deviation of a sample.
In both cases, I recommend using the latter versions—STDEV.P for population and STDEV.S for sample—because they are the newer, more descriptive functions. The “.P” and “.S” suffixes clearly indicate the context (Population or Sample), making the formula more readable.
At the time of writing, all of these functions work in Google Sheets, and I believe they will remain available for compatibility purposes.
Before diving into the syntax of the STDEV.P function in Google Sheets, let’s quickly see how to insert the standard deviation symbol.
Inserting the Standard Deviation Symbol in Google Sheets
We represent standard deviation with the Greek letter sigma (lowercase), which looks like this: σ.
You can insert it in Google Sheets using the following CHAR formula:
=CHAR(963)Here, 963 is the Unicode number for the lowercase sigma character.
Standard Deviation of an Entire Population – Manual Calculation in Sheets
This manual method will help you understand how standard deviation works before using a function like STDEVP in Google Sheets.
In statistics, standard deviation measures how spread out the values are in a dataset.
Interpreting the Standard Deviation Result:
- Low σ: Values are close to the average (mean).
- High σ: Values are spread out over a wider range.
Sample Data:
160
140
172
130
90
Step-by-Step Manual Calculation:
1: Find the Mean (Average)
=(160+140+172+130+90)/5 → Result: 138.42: Find the Difference of Each Value from the Mean and Square It
=(160-138.4)^2 + (140-138.4)^2 + (172-138.4)^2 + (130-138.4)^2 + (90-138.4)^2 → Result: 4011.23: Average the Sum of Squared Differences (Variance – σ²)
=4011.2/5 → Result: 802.24Final Step: Take the Square Root to Get σ
σ = √802.24 → Result: 28.32Instead of calculating all that manually, you can use the STDEVP or STDEV.P function in Google Sheets.
STDEVP / STDEV.P Function Syntax
Syntax:
STDEVP(value1, [value2, ...])
STDEV.P(value1, [value2, ...])
Arguments:
value1– The first value or array/range of the population.value2– Additional values or arrays/ranges to include in the population.
Practical Example with STDEVP Formula
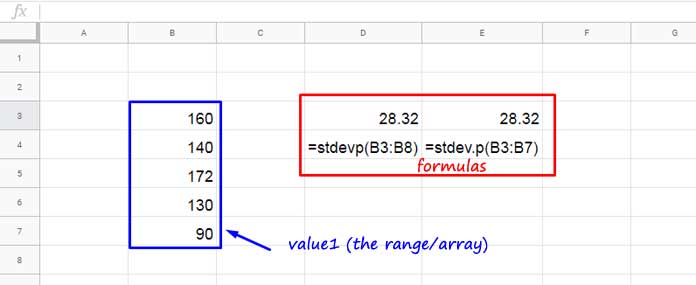
To match our manual calculation above, use the same values in cells B3:B7.
=STDEVP(B3:B7)
=STDEV.P(B3:B7)
These will return the same result as the manual method—28.32.
As mentioned earlier, the standard deviation of an entire population is simply the square root of its variance. You can also use this alternative formula:
=SQRT(VARP(B3:B7))This formula calculates the variance using VARP, then takes the square root to return the standard deviation—just like STDEVP.
Function Behavior and Usage Notes
Keep in mind how the function behaves based on how you use it:
When using cell or range references:
- Blank cells, Booleans, or text are ignored (only numeric values count, including zero).
- Errors within the range will return an error.
When using direct values inside the formula:
- Text or error values will cause the formula to return an error.
- Boolean values are evaluated as 1 (
TRUE) and 0 (FALSE). - Text representations of numbers (e.g., “100”) are counted as valid.