How to split a task in a conditional format based Gantt Chart in Google Sheets?
If a started task has been interrupted for some reason, in the Gantt chart, the corresponding task (bar) may need to be split.
In this post, I am trying to shed some light on how to split a task (bar) into two sections in a Gantt Chart in Google Sheets.
Creating a Gantt Chart in Google Sheets is easy using conditional formatting. I’ve already published a post on the same (if you have not seen, here is the link – Create Gantt Chart Using Formulas in Google Spreadsheet).
In such basic Gantt charts, we can split tasks into two sections very easily.
As a side note, there are two other methods to create custom Gantt Charts in Google Sheets. Here are them.
- Create a GANTT Chart in Google Sheets Using Stacked Bar Chart.
- Create a Gantt Chart Using Sparkline in Google Sheets.
Coming back to the topic, i.e. how to split a task in a Gantt chart in Google Sheets, let me explain each and every step involved in detail.
Gantt Chart Using Conditional Formatting
Just by applying a conditional format rule (a custom formula in conditional formatting), we can create a simple Gantt chart in Google Sheets. Yes! You heard me right.
For advanced Gantt chart, you may try project management software products like Wrike.
Even though I have detailed the steps to create a Gantt chart using conditional formatting earlier, here again, I am repeating the same.
The reason, to split a task in the Gantt chart we will use the same format rule, but in a slightly different way.
Let’s create conditional format bars (Gantt chart) for two tasks. But you can add as many tasks as you wish, the rule will automatically be applied.
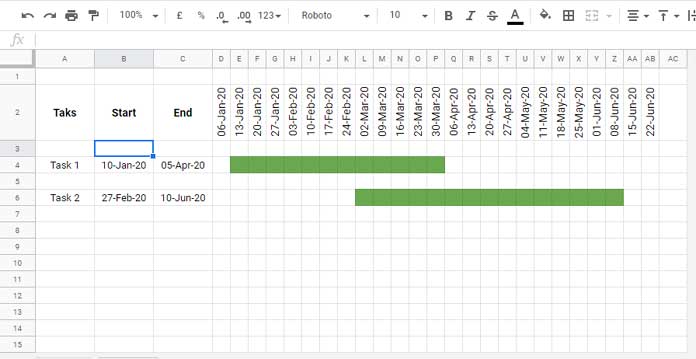
See this example chart (before splitting tasks).
Sheet Preparation (Formatting)
In a Gantt chart, to draw/highlight a bar, there must be a task start column (here column B), task end column (here column C) and a row (here D2:AB2) with the scheduled periods (dates) in sequential order.
You can manually enter the dates in the row or use a formula to automatically populate the dates.
Since my schedule is in the number of weeks (weekly schedule) starting from 06-Jan-2020 and has a duration of 25 weeks, I have used the below array formula in cell D2.
=sequence(1,25,date(2020,1,6),7)In this SEQUENCE formula, 25 represents 25 weeks and 7 represents 1 week (7 days), i.e. the step value. So to extend the number of weeks, change the number 25 to the number of weeks required.
You can change the weekly schedule to a monthly schedule or a daily schedule by manually entering the dates accordingly in row D2:AB2.
The above settings are common for creating bars in Gantt charts as well as splitting the tasks (bars) in the Gantt chart in Google Sheets.
Custom Formula
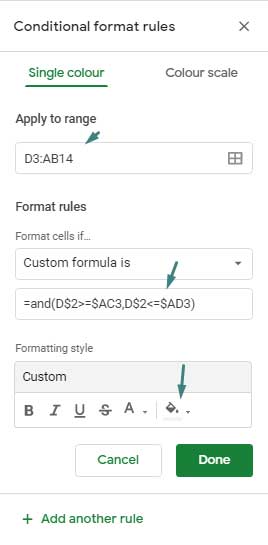
As per my Gantt chart, the bar area is the range D3:AB14. Select this range, then open the ‘Conditional format rules’ sidebar panel by clicking Format > Conditional formatting.
Insert the below formula as per the screenshot that follows.
=and(D$2>=$B3,D$2<=$C3)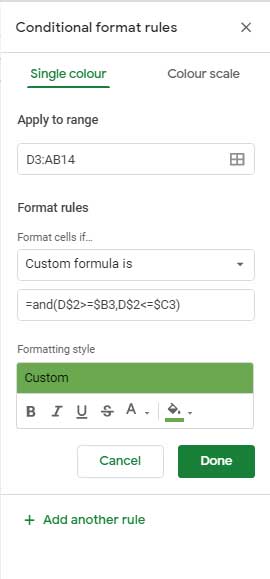
The above formula will highlight the cells (create bars) based on the task start date and end dates.
You can add more tasks. For example, enter “Task 3” in cell A8 and its start and end dates in cell B8 and C8 respectively.
The above formula will take care of this newly added task and any subsequent tasks below it.
Now, time to see how to split a task in a custom Gantt Chart in Google Sheets.
Split a Task in Conditional Format Based Gantt Chart in Google Sheets
Sometimes we may be required to interrupt a running task due to some reason like waterlogging in case of civil/mechanical construction work.
In such a scenario, we can think about splitting the task to show the task interruption. For example, consider the “Task 1”.
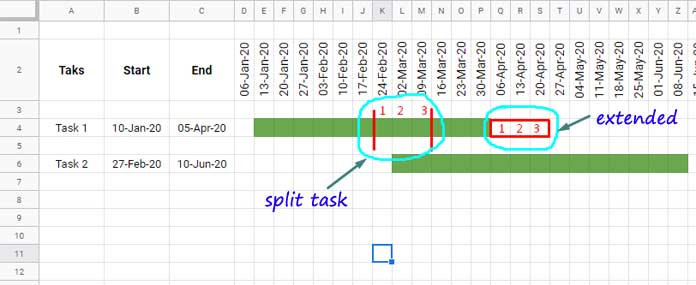
In this, I want to split the task for three weeks from 24-Feb-20 to 09-Mar-20. So the highlighting (bar) must be removed from the range K4:M4. Then I want to extend the bar from P4 to S4 to accommodate the three interrupted weeks.
To extend the bar, we can simply change the end date in cell C4 to 20-Apr-20. But to remove the highlighting from the bar, follow the below steps.
Splitting Tasks in Gantt Chart in Google Sheets
Here are the steps to split a task in a custom type Gantt chart in Google Sheets.
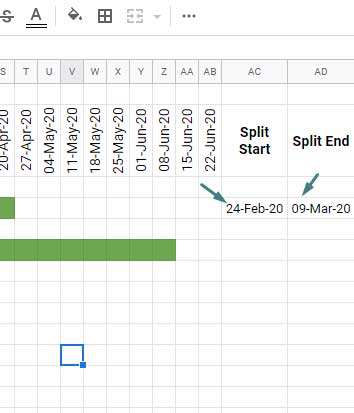
We need two more columns. So I am choosing column AC and AD, the last two columns.
How to split tasks?
As an example, enter the split task start date 24-Feb-20 in the cell AC4 and split task end date 09-Mar-20 in the cell AD4 (3 weeks).
Then copy the earlier formula (under the title ‘Custom Formula’).
Select the range D3:AB14 and then go to the conditional format rules panel and insert the copied formula.
Change the cell references in the inserted formula like B3 with AC3 and C3 with AD3.
The Formula After Changes:
=and(D$2>=$AC3,D$2<=$AD3)Choose white or light gray as the fill color.
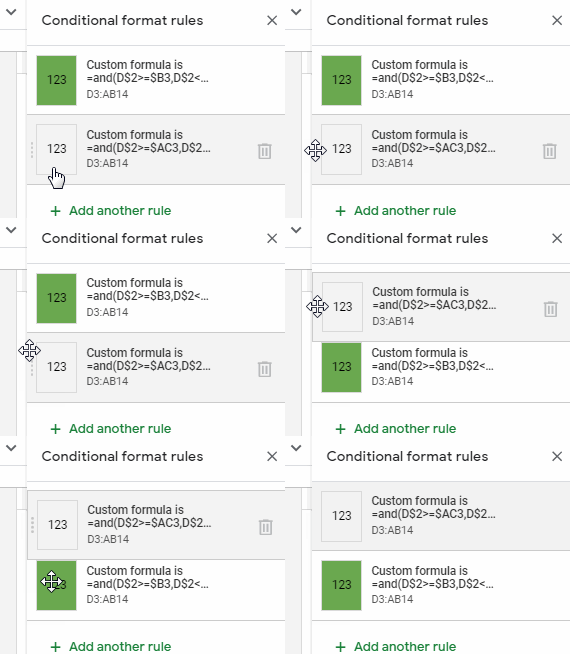
The newly created rule must be placed on the top of the earlier rule. See the GIF below.
Additional Steps
Change the date in cell C4 from 05-Apr-20 to 24-Apr-20 to add the split period (3 weeks). That means if the split periods are three weeks, add three weeks to the task end date.
We have split the first task. To split the second task just insert the split start and end dates in cell AC6 and AD6 respectively. Also, extend the weeks accordingly by changing the end date in cell C6.
For example;
Split Start in Cell AC6: 16-Mar-20.
Split End in Cell AD6: 16-Mar-20.
(both the dates are the same as task 2 is to split for one week only).
End Date in Cell C6: 15-Jun-20.
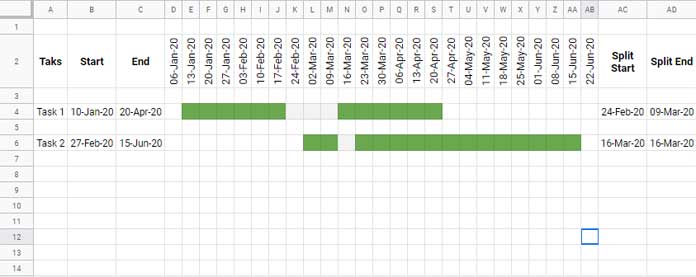
This way we can split a task in a conditional format based Gantt chart in Google Sheets.
Removing Split in Tasks in Gantt Chart in Google Sheets
To remove split tasks, just remove the dates in column AC and AD. Also, revert back to the earlier end dates in column C.


