


")


")

")
")
 in Excel & Google Sheets")


When tracking financial data, budgets, or sales in Google Sheets, you may need a running total that resets at the start of each year. A standard running total (cumulative sum) keeps adding values across all dates, but for yearly reports, performance tracking, or accounting, you’ll want the total to restart once the year changes.
In this guide, we’ll cover:
- Sample data with expected output
- Different formulas to reset a running total by year
- Pros and cons of each formula (drag-down vs. array formula)
- A faster option for large datasets
Common Issues You May Face
When working on this in Google Sheets, you might encounter a few challenges:
- The column may contain dates or just years – the formula must adapt.
- The date/year column may not be sorted – the formula should still work.
- In very large datasets, some formulas may stop responding – we’ll provide a lightweight alternative.
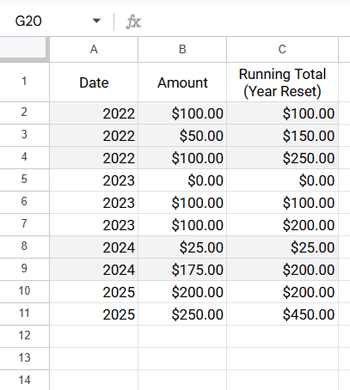
Sample Data
Here’s an example dataset. Column C shows the running total that resets at each year change.

👉 Note: The sample is sorted by date. But the formulas below will also work in unsorted ranges.
Formulas to Reset Running Totals by Year in Google Sheets
1. Drag-Down Formula (Works on Sorted or Unsorted Data)
If your data is in A1:B (with headers in row 1), enter this in C2 and drag down:
=SUMPRODUCT($B$2:$B2, YEAR($A$2:$A2)=YEAR(A2))Explanation:
YEAR($A$2:$A2)=YEAR(A2)→ checks if each row’s year matches the current row’s year.- This returns a series of
TRUE/FALSEvalues (which act like1/0). - SUMPRODUCT multiplies those results with the corresponding amounts in column B, summing only the rows from the same year.
✅ Works whether or not your date column is sorted.
✅ Easy to implement.
If your column contains only years (not full dates), replace:
YEAR($A$2:$A2)with$A$2:$A2YEAR(A2)withA2
Note: Since the column contains only years, the comparison works directly on the numeric year values. No need to wrap them in YEAR() function.
2. Array Formula with MAP and LAMBDA
Instead of dragging down, you can use an array formula. Place this in C2:
=MAP(A2:A, B2:B, LAMBDA(date_, value_,
   IF(LEN(date_), SUMPRODUCT(B2:value_, YEAR(A2:date_)=YEAR(date_)), )
))
👉 If your column contains only years (instead of full dates), use this adjusted version:
=MAP(A2:A, B2:B, LAMBDA(date_, value_,
   IF(LEN(date_), SUMPRODUCT(B2:value_, A2:date_=date_), )
))
Key Points:
LEN(date_)→ prevents results from appearing in empty rows.- Uses open-ended ranges (
A2:A,B2:B) so it automatically expands as you add new rows.
⚠️ Drawback: On very large datasets, this may slow down or stop responding since MAP + SUMPRODUCT is resource-heavy.
3. Faster Alternative for Large, Sorted Data
If your date column is sorted, this lighter SUMIF-based formula is better. Place it in C2:
=ArrayFormula(
  IF(LEN(A2:A),
     SUMIF(ROW(B2:B), "<="&ROW(B2:B), B2:B) - SUMIF(YEAR(A2:A), "<"&YEAR(A2:A), B2:B),
  ))
👉 For datasets where column A contains only years (not full dates), apply this modified version:
=ArrayFormula(
  IF(LEN(A2:A),
     SUMIF(ROW(B2:B), "<="&ROW(B2:B), B2:B) - SUMIF(A2:A, "<"&A2:A, B2:B),
  ))
Formula Breakdown:
SUMIF(ROW(B2:B), "<="&ROW(B2:B), B2:B)→ creates a cumulative sum by row.SUMIF(YEAR(A2:A), "<"&YEAR(A2:A), B2:B)(orSUMIF(A2:A, "<"&A2:A, B2:B)for year columns) → subtracts all previous years’ totals.- The difference gives a running total that resets at every year change.
✅ Best choice for large, sorted datasets.
✅ Lightweight compared to the MAP formula.
Final Thoughts
Resetting a running total by year in Google Sheets is very useful for annual reports, sales tracking, and budget analysis.
- Use the drag-down SUMPRODUCT formula for simplicity.
- Try the array formula for automation.
- Switch to the SUMIF-based array formula for large datasets.
With these methods, you’ll always have accurate yearly running totals in Google Sheets—whether your data is sorted, unsorted, or massive.
Related Guides
- Array Formula for Conditional Running Totals in Google Sheets
- Running Total by Category in Google Sheets
- Running Total with Monthly Reset in Google Sheets
- Weekly and Biweekly Running Totals in Google Sheets
- Reset Running Total at Blank Rows in Google Sheets
- Running Total with Multiple Subcategories in Google Sheets