The easiest way to summarize, analyze, and report data in Google Sheets is by using a pivot table. There’s no need to write complex formulas, which makes pivot tables the best tool for beginners and intermediate users alike.
For advanced users, of course, there is the QUERY function. That said, pivot tables also support calculated fields with custom formulas, a feature often required by experienced users. We’ll discuss calculated fields separately in a dedicated guide.
This Google Sheets Pivot Table tutorial walks you through everything you need to know—from creating your first pivot table to handling common date-grouping limitations.
Whether you’re building a simple report or solving advanced grouping problems, this hub links to step-by-step tutorials for each use case.
What You’ll Learn in This Google Sheets Pivot Table Tutorial
This hub covers:
- How to create pivot tables correctly
- When and how to use helper columns
- Native vs workaround date grouping
- When QUERY is a better alternative than pivot tables
Each section below links to a focused, in-depth guide.
How to Create a Pivot Table Report in Google Sheets
If you’re new to pivot tables, start here.
This tutorial shows how to:
- Select and prepare source data
(includes a sample sheet to help you get started quickly) - Insert a pivot table
- Add rows, columns, values, and filters
- Build a clean summary report from raw data
➡️ How to Create a Pivot Table Report to Summarize Data in Google Sheets
Age Analysis Using Google Sheets Pivot Tables
Some analyses require calculations that pivot tables cannot create on their own. In such cases, you need a helper column to categorize data before pivoting. Age analysis is a classic example.
For instance, you may have an invoice date column. Using a helper formula, you can calculate aging (0–30 days, 31–60 days, etc.) in another column and then use that column in the pivot table.
This guide explains:
- Adding a helper column (age / aging)
- Grouping records into age buckets
- Creating an aging report using a pivot table
➡️ Age Analysis with Google Sheets Pivot Tables
Group Dates in Pivot Tables (Month, Quarter, and Year)
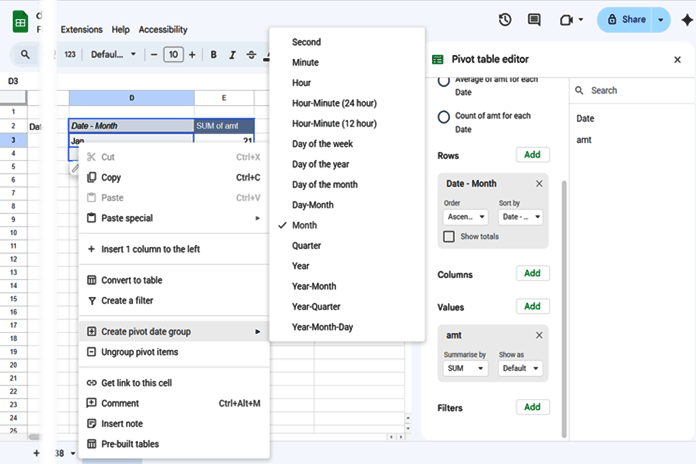
Google Sheets supports native date grouping in pivot tables—but only for specific units, such as:
- Second
- Minute
- Hour
- Hour–Minute (24-hour / 12-hour)
- Day of week (eg., Sunday)
- Day of month (eg., 30)
- Day of year (eg., 89)
- Day-Month (eg., 2-Jan)
- Month
- Quarter
- Year
- Year–Month
- Year–Quarter
- Year–Month–Day (Groups by full date (year, month, and day), equivalent to daily grouping. The time portion is ignored if present.)
Among these, month, quarter, and year grouping are the most commonly used. Once you learn this approach, the other options are easy to apply.
This tutorial covers:
- Grouping dates by Month and Year-Month
- Grouping by Quarter and Year-Quarter
- Grouping by year
- Common issues when date grouping is unavailable
➡️ Group Dates in Pivot Table in Google Sheets (Month, Quarter, and Year)
How to Group by Week in a Pivot Table (Workaround)
Google Sheets does not offer a built-in “group by week” option in pivot tables. This limitation becomes clear when you review the available date-grouping options.
To group data by week, you must use a helper column.
This guide explains:
- Why week grouping isn’t supported natively
- Using a helper column with week numbers
- Grouping by week ranges (Mon–Sun)
➡️ How to Group by Week in Pivot Table in Google Sheets
Group Data by Month and Year: Pivot Table vs QUERY
We’ve already seen how to group dates by month and year in pivot tables using options like Year-Month. However, pivot tables are not always the best tool—especially when:
- You need more control over calculations
- You’re building dashboard reports
- You’re creating charts directly from summarized data
- You want to import and summarize data directly using
IMPORTRANGE + QUERY
This tutorial shows:
- Grouping data by month and year using QUERY
- Comparing QUERY vs pivot table approaches
- When QUERY is the better choice
➡️ How to Group Data by Month and Year in Google Sheets
Google Sheets Pivot Table Limitations You Should Know
While pivot tables are powerful, they do have limitations:
- To extract data from a pivot table, you must use the GETPIVOTDATA function
- Pivot charts are not available in Google Sheets
- Default formatting may not suit reporting needs
- No built-in week grouping
- Limited calculated field support
This Google Sheets Pivot Table tutorial covers the full pivot table setup, explains how to overcome week grouping limitations, and introduces QUERY as a flexible alternative.
For more advanced and customized reporting, see my QUERY Pivot & Reporting in Google Sheets resources.
Final Thoughts
This Google Sheets Pivot Table Tutorial is designed to grow with you—from your first pivot table to advanced date-grouping strategies.
- If you’re just starting, begin with creating a pivot table report
- If you’re stuck on date grouping, jump straight to the month, quarter, or week guides
- If pivot tables hit a wall, use QUERY with confidence
Bookmark this hub and use it as your go-to reference for pivot tables in Google Sheets.


