Let’s master a key skill in Google Sheets: calculating percentages of a total. This is useful for analyzing sales data, budgets, and survey results, and it’s a relatively simple task.
Percentages help you understand how each value compares to the total. In this guide, I’ll walk you through the steps using simple formulas. By the end, you’ll be confident in applying this technique to your own sheets.
The Formula to Calculate Percentage of Total in Google Sheets
Use the following formula to calculate the percentage of a total in Google Sheets:
=ArrayFormula(TO_PERCENT(IF(range="",,range/SUM(range))))rangerefers to the column or row where your data is located.- For example, if your data is in
B1:B, replacerangewithB1:B.
Example: Calculating Percentage of Total in Google Sheets
Here’s an example using administrative expenses in column B and their descriptions in column A. Let’s calculate what percentage each expense contributes to the total.
Sample Data: Administrative Expenses
| A | B |
| Licensing & Fees | 735 |
| Vehicle Registration | 0 |
| Visa Processing | 0 |
| Sundry Office Expenses | 653 |
| Local Conveyance | 82 |
| Medical Expense | 240 |
| Accommodation Charges | 0 |
| Office Rent | 6000 |
| Electricity | 733 |
| Trade License Renewal | 2200 |
To calculate the percentages, enter the following formula in cell C1:
=ArrayFormula(TO_PERCENT(IF(B1:B="",,B1:B/SUM(B1:B))))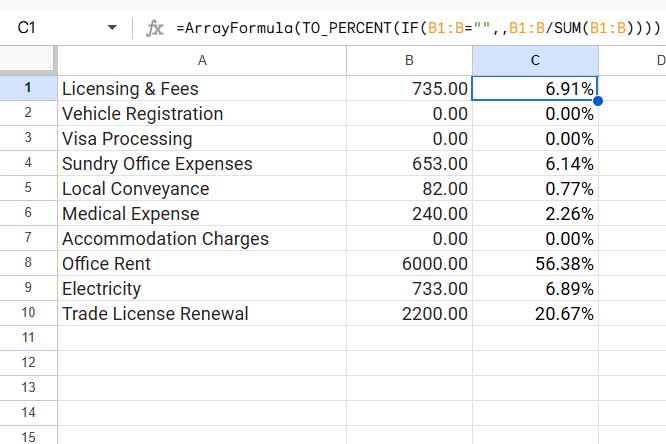
Key Points:
- Replace
B1:Bwith your data range if it differs. - Ensure the column where you apply the formula has enough blank rows to display the results, as it’s an array formula. For example, if the range is
B1:Band you apply the formula inC1,C1:Cshould be empty. If the range isB1:B100and the formula goes inC1, thenC1:C100must be empty.
Let’s break down the formula so that you can understand what each component does to return the percentage of the total.
Explanation of the Formula
ArrayFormula- Enables the formula to process the entire range (
B1:B) in one go, without dragging it down row by row.
- Enables the formula to process the entire range (
IF(B1:B="",,...)- Logical Test: Checks if a cell in
B1:Bis empty.- If empty, returns a blank (
""). - Otherwise, it proceeds to calculate the percentage of the total.
- If empty, returns a blank (
- Logical Test: Checks if a cell in
B1:B/SUM(B1:B)- Divides each value in
B1:Bby the total sum of all values in the range. - This calculates the proportion of each value relative to the total.
- Divides each value in
TO_PERCENT(...)- Converts the resulting decimal values into percentage format.
- Example:
0.25becomes25%.
Additional Resources
Explore these guides for more on working with percentages in Google Sheets:
- Percent Distribution of Grand Total in Google Sheets Query
- How to Use Percentage in IF Statements in Google Sheets
- Query to Filter a Column Containing Percentage Values in Google Sheets
- Percentage Change Array Formula in Google Sheets
- How to Round Percentage Values in Google Sheets
- How to Limit a Percentage Value Between 0 and 100 in Google Sheets
- Calculating the Percentage Between Dates in Google Sheets
- How to Calculate Percentage Difference in Google Sheets
- How to Calculate Reverse Percentage in Google Sheets
- Calculate Percentage Position Within a Range (Google Sheets)
- Fix Fractional Percentage Formatting Issues in Google Sheets


