


")


")

")
")
 in Excel & Google Sheets")


If you’ve ever tried to calculate Quarter-on-Quarter (QoQ) Growth in Google Sheets, you probably noticed one thing: there’s no built-in function for it. The only way to do it is with formulas—and creating them can be tricky.
In this guide, I’ll walk you through a step-by-step method to calculate QoQ growth, and I’ll also share a single formula solution that generates the full QoQ table instantly. Along the way, I’ll highlight common challenges and tips to handle them.
Why Quarter-on-Quarter (QoQ) Growth Matters
Quarter-on-Quarter (QoQ) growth measures the percentage change in a metric from one fiscal quarter to the next. It’s a powerful tool to quickly track trends, spot unusual spikes, and evaluate short-term performance.
Knowing your QoQ growth helps you:
- Identify patterns of growth or decline in a specific period.
- Compare performance against previous quarters for informed decision-making.
- Spot seasonal trends or unusual fluctuations in your data.
Common use cases:
- Sales analysis: Track quarterly revenue, units sold, or subscription growth.
- Financial reporting: Monitor profit, expenses, or cash flow changes each quarter.
- Business metrics: Evaluate KPIs like customer acquisition, churn rate, or production output.
Calculating QoQ growth in Google Sheets gives you a time-sensitive view of your performance, making forecasting and planning much easier.
Common Challenges When Calculating QoQ Growth
Even with formulas, there are a few common challenges:
- Assigning quarters correctly: If you have raw data with dates and amounts, you need to assign each row to the correct quarter based on your financial or fiscal year.
- Handling empty quarters: Some quarters might have no transactions. If you don’t handle these, your formula might incorrectly use the previous available quarter, giving a misleading result.
- Multi-year datasets: If your data spans more than one calendar or fiscal year, you need formulas that correctly handle year changes to maintain accuracy.
With these challenges in mind, the solution I’m sharing works for single-year or multi-year datasets and handles empty quarters automatically.
Sample Data for QoQ Growth Calculation
Here’s an example dataset in columns Date and Amount (columns A and B in Google Sheets):
| Date | Amount |
| 01/01/2025 | $5,000.00 |
| 15/01/2025 | $8,500.00 |
| 29/01/2025 | $5,000.00 |
| 12/02/2025 | $8,500.00 |
| 26/02/2025 | $8,500.00 |
| 12/03/2025 | $5,000.00 |
| 26/03/2025 | $5,000.00 |
| … | … |
Tip: Make sure your data is sorted by date in ascending order:
- Select the range (excluding headers).
- Go to Data → Sort range → Sort range by column A (A to Z).
Sorting first keeps the formulas simple and ensures accurate results.
Step 1: Assign Quarter Labels
The first step is to label each row with the correct quarter — either the calendar-year quarter or your company’s fiscal-year quarter. In cell C2, enter:
=ArrayFormula(LET(dt, A2:A, start, 1, fqtr, INT(MOD(MONTH(dt)-start, 12)/3+1), fyrs, YEAR(dt)-(MONTH(dt)<start), fyre, RIGHT(YEAR(dt)+(MONTH(dt)>=start), 2), IF(dt="",,"Q"&fqtr&" FY "&fyrs&IF(start=1,,"-"&fyre))))Replace start with the month your fiscal year begins.
- Examples: Jan → 1, Apr → 4, Jul → 7
- Tip: You can use any month as the starting month of your fiscal year—just enter its number.
This formula automatically assigns a quarter to each date, which is crucial for the next steps.

Note: You can read the formula explanation in detail in my previous post: Convert Dates to Fiscal Quarters & Years in Google Sheets.
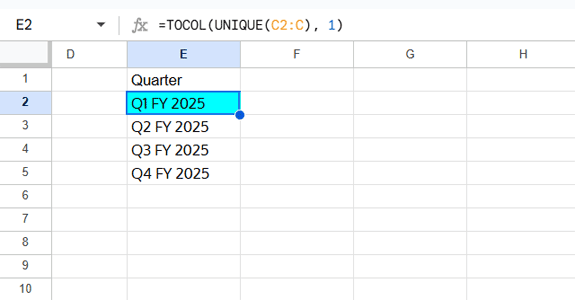
Step 2: List Unique Quarters
To create the QoQ table, you need a list of unique quarters. In cell E2, use:
=TOCOL(UNIQUE(C2:C), 1)TOCOL flattens the range and removes empty cells, giving you a clean list of quarters for the table.
Step 3: Calculate Quarterly Sums
Next, sum the amounts for each quarter. In cell F2, enter:
=ArrayFormula(IF(E2:E="",,SUMIF(C2:C, E2:E, B2:B)))This gives the total for each quarter, which will be used to calculate QoQ growth.

Step 4: Calculate Quarter-on-Quarter (QoQ) Growth
Now we calculate the QoQ growth percentage. In cell G2, use this formula and drag down:
=TO_PERCENT(IFERROR(
  IF(
    OR(
      AND(VALUE(MID(E1, 2, 1))=VALUE(MID(E2, 2, 1))-1, VALUE(MID(E1, 7, 4))=VALUE(MID(E2, 7, 4))),
      AND(VALUE(MID(E1, 2, 1))=4, VALUE(MID(E2, 2, 1))=1, VALUE(MID(E2, 7, 4))=VALUE(MID(E1, 7, 4))+1)
    ),
   (F2-F1)/F1,
   NA()
  ),"—"
))
How it works:
- Checks if the previous quarter is consecutive (same year or year rollover).
- Calculates
(Current Quarter – Previous Quarter) / Previous Quarterif consecutive. - Returns
"-"if quarters aren’t consecutive or if the previous quarter has no data. TO_PERCENTformats the result as a percentage.
Dynamic Array Formula (All-in-One) for QoQ Growth
If you prefer a single formula that generates the entire QoQ growth table automatically, try this in a blank column:
=ArrayFormula(LET(
  qtr, TOCOL(UNIQUE(C2:C), 1),
  amt, SUMIF(C2:C, qtr, B2:B),
  qtrN, MID(qtr, 2, 1),
  qtrY, MID(qtr, 7, 4),
  QoQ,
    MAP(SEQUENCE(ROWS(qtr)), LAMBDA(r, TO_PERCENT(IFERROR(
      IF(
        OR(
          AND(VALUE(CHOOSEROWS(qtrN, r-1))=VALUE(CHOOSEROWS(qtrN, r))-1, VALUE(CHOOSEROWS(qtrY, r-1))=VALUE(CHOOSEROWS(qtrY, r))),
          AND(VALUE(CHOOSEROWS(qtrN, r-1))=4, VALUE(CHOOSEROWS(qtrN, r))=1, VALUE(CHOOSEROWS(qtrY, r))=VALUE(CHOOSEROWS(qtrY, r-1))+1)
        ),
       (CHOOSEROWS(amt, r)-CHOOSEROWS(amt, r-1))/CHOOSEROWS(amt, r-1),
       NA()
      ),"–"
    )))),
  VSTACK(HSTACK("Quarter", "Value", "QoQ Growth %"), HSTACK(qtr, amt, QoQ))
))
This formula combines steps 2–4, giving you a fully automated QoQ table instantly.

FAQs on Calculating QoQ Growth in Google Sheets
Q: What if a quarter has no transactions?
A: The formula will return "-" for the next quarter’s growth and skip the no-transaction quarter.
If you want the no-transaction quarter to appear with -100% growth, simply include a date in that quarter with an amount of 0.
Q: Can I use this for any fiscal year?
A: Yes! Just update the start parameter in the quarter formula.
Q: Can this work with large datasets?
A: Yes, it works well for hundreds or a few thousand rows. Since the formula uses MAP, performance may slow down with very large datasets (e.g., tens of thousands of rows). For extremely large data, consider breaking it into smaller ranges.
Conclusion
This is the first complete solution on the web for calculating Quarter-on-Quarter (QoQ) Growth in Google Sheets using formulas. With this method, you can track sales, finances, or any metric over multiple quarters and years—fully automated and accurate.
No plugins, no manual calculations—just smart formulas!
Resources
To deepen your understanding and extend your Google Sheets skills for quarterly analysis, check out these related guides:
- How to Calculate Year-on-Year (YoY) Growth in Google Sheets
- How to Group Dates by Quarter in Google Sheets
- Query Daily, Weekly, Monthly, Quarterly, and Yearly Reports in Google Sheets
- Extract Quarter from a Date in Google Sheets: Formulas
- How to Query Non-Calendar Quarters in Google Sheets
- Google Sheets Formula for Current Quarter and Previous Quarter
- How to Calculate Average by Quarter in Google Sheets