We have already learned the PV and NPV functions. In this tutorial let’s learn the use of the XNPV function in Google Sheets.
The purpose of the XNPV function, one of the financial functions in Sheets, is to calculate the net present value for a schedule of irregularly spaced cash flows.
If the cash flows are periodic, then we can use the NPV instead of the XNPV function. You will get the NPV vs the XNPV formula comparison at the very end of this tutorial.
To calculate XNPV, we must input the discount rate and cash flows with corresponding periods as two arrays.
Regarding the discount rate, I’ve already touched it in my NPV function tutorial. In concise;
We normally use net present value to compare money now with money in the future. The money now has earning potential.
So we must ‘discount’ the money we earn in the future to express it in today’s dollars. The discount rate is the rate of return that the investors expect.
Many financial calculators include the NPV function. But it’s best to use Google Sheets to calculate the net present value as we can calculate the NPV of the irregularly spaced cash flows too.
XNPV Function – Syntax and Arguments
Syntax:
XNPV(discount, cashflow_amounts, cashflow_dates)Arguments:
All the three arguments are required. There is no optional argument in this function.
discount ✓ – The discount rate to apply to the cash flows.
cashflow_amounts ✓ – Income or payments.
cashflow_dates ✓ – Dates that corresponds to the cash flow_amounts.
Points to be Noted:
The XNPV function in Google Sheets requires the cashflow_dates in the range/array to be on or after the first date in the range/array. The order of the remaining dates is not a problem.
If the first cashflow_amounts is a cost or payment, it must be a -ve value. All succeeding payments are discounted based on a 365-day year.
Formula Example
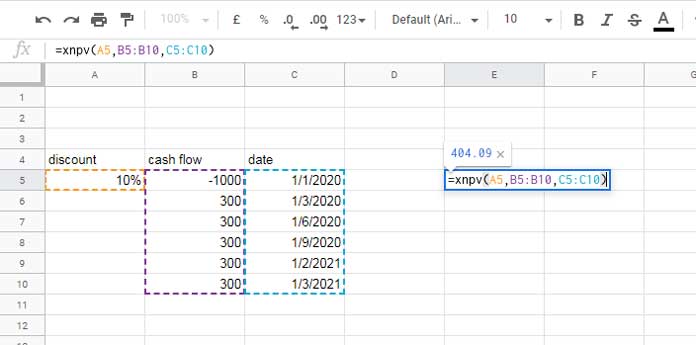
In the following XNPV formula example, the discount rate is 10% which is in cell A5. The cash flow amounts are in the range B5:B10 and the corresponding cash flow dates are in the range C5:C10.
The value in cell B5 is negative as it’s the initial investment.

XNPV Formula:
=xnpv(A5,B5:B10,C5:C10)If the dates specified in the range C5:C10 is at a regular interval, which is not the case in the above example, then we can use the NPV function instead.
Let’s assume the dates in the range C5:C10 are 01/01/2020, 01/01/2021, 01/01/2022, 01/01/2023, 01/01/2024, and 01/01/2025 (all in dd/mm/yyyy format).
Now the dates are at regular intervals. So we can use NPV here. The below NPV and the above XNPV with new dates would return 137 as the net present value.
=npv(A5,B6:B10)+B5Conclusion
If the net present value (NPV or XNPV) is -ve, the project is not a good one. It is going to ultimately drain cash from the business.
However, if it’s +ve, which is the case in our example, the project should be accepted. The larger the +ve number, the greater the benefit to the company.
By wrapping XNPV with IF, in a glance, we can find whether a project is worth to accept or not. Here is that example.
=if(xnpv(A5,B5:B10,C5:C10)>0,"Can consider")You can try different variations of the IF statement like star rating as below.
=if(xnpv(A5,B5:B10,C5:C10)>1000,"*****",if(xnpv(A5,B5:B10,C5:C10)>500,"****",if(xnpv(A5,B5:B10,C5:C10)>100,"***",if(xnpv(A5,B5:B10,C5:C10)>0,"**","quit" ))))That’s all about how to use the XNPV function in Google Sheets. Thanks for the stay, Enjoy!


