


")


")

")
")
 in Excel & Google Sheets")


You can use a combination of FILTER and COUNTIFS to filter the top N records per category in Excel. This is a powerful formula for analyzing the performance of items categorized under different groups.
Assume you are running a chain of apparel outlets. You want to find the top three best-selling T-shirts in your stores across the country. This data can help in several ways—for example, by stocking more of the best-selling brands or focusing on marketing other items through discounts, promotional sales, etc.
Generic Formula to Filter Top N per Category in Excel
=SORT(FILTER(data_range, (category_range<>"")*(COUNTIFS(category_range, category_range, rank_range, ">"&rank_range)+1<=n)), {category_range_index, rank_range_index}, {1, -1})Formula Components:
data_range– The range containing the dataset.category_range– The range reference for the category column.rank_range– The range reference for the ranking column.n– Determines the number of top records to return.category_range_index– The column position of the category column withindata_range.rank_range_index– The column position of the ranking column withindata_range.
Note: All ranges should be of equal size.
This formula works only in Excel 365 and later versions that support dynamic arrays and functions like FILTER, SORT, and COUNTIFS.
Sample Data for Filtering Top N per Category in Excel
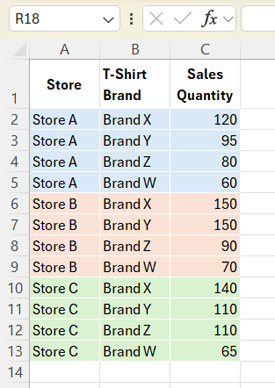
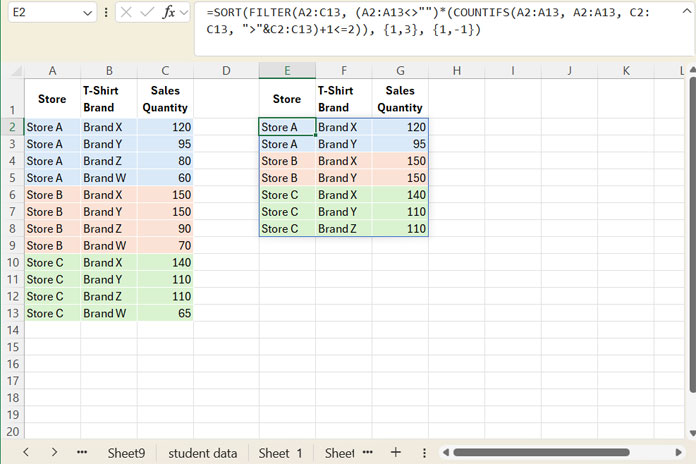
In this example, we will filter the top 2 best-selling T-shirt brands from each store.
Formula for Filtering Top 2 T-Shirts per Store
Using the above dataset, enter the following formula in cell E2:
=SORT(FILTER(A2:C13, (A2:A13<>"")*(COUNTIFS(A2:A13, A2:A13, C2:C13, ">"&C2:C13)+1<=2)), {1, 3}, {1, -1})This formula helps filter the top N items per category in Excel.
Formula Explanation
1. Group-wise Ranking in Excel
The key part of the formula is computing the rank per group:
COUNTIFS(A2:A13, A2:A13, C2:C13, ">"&C2:C13) + 1This assigns a group-wise rank to each item within its category.
2. Filtering the Top N per Category
FILTER(A2:C13, (A2:A13<>"")*(COUNTIFS(A2:A13, A2:A13, C2:C13, ">"&C2:C13)+1<=2))This filters rows where:
- The category column is not blank.
- The rank is ≤ 2, ensuring we get the top 2 items per store.
3. Sorting the Results
SORT(..., {1, 3}, {1, -1})- The
SORTfunction arranges results in ascending order by Store (column 1). - Within each store, the results are sorted in descending order by Sales Quantity (column 3).
How Does the Formula Handle Duplicates?
Since the formula uses ranking, it returns the top N items plus all occurrences of the Nth-ranked item. This ensures fairness and accuracy in reporting.
For example, in Store C, both Brand Y and Brand Z have 110 sales, so they are both included in the top 2.