


Before starting this tutorial, I highly recommend you to check my Percentile function tutorial. So that you can quickly learn the use of Percentrank functions in Google Sheets.
When you start entering the Percentile function in Sheets, you may notice the tool-tip with two functions in this category – PERCENTILE and PERCENTILE.INC. Both are the same and may be kept due to compatibility with other Spreadsheet applications.
There are three Percent Rank functions in Google Docs Sheets. They are PERCENTRANK, PERCENTRANK.EXC and PERCENTRANK.INC.
Don’t worry, I am going to explain each one of them in detail that also with formula examples.
How to Use PERCENTRANK Functions in Google Sheets
The PERCENTRANK functions used as a way to interpret the percent of cases that are at or below a score in standardized tests.
Use Google Sheets PERCENTRANK functions to return the percentile of a specified value in a dataset. That percentile is the percentage rank.
The available three Percentrank functions are detailed below.
Formula Example to Percentrank Function in Sheets
Syntax of Google Sheets PERCENTRANK Function:
PERCENTRANK(data, value, [significant_digits])See the difference between Percentile and Percentrank functions below. The PERCENTRANK function arguments are detailed in between.
Percentile vs Percent Rank in Google Sheets:
The above example shows the height of a group of people in ascending order in row # 3.
Actually, there is no need to sort this data. Sorting is only required in a
The Percentile formula in cell L3 returns the value at 0.5 (50%) percentile of the given dataset.
=PERCENTILE(A3:I3,0.5)That value is 178. Whereas, the Percentrank formula returns the percent rank of the value 178, i.e. 0.5 (50%).
=PERCENTRANK(A3:I3,178)In the just above formula A3
I didn’t use any significant digits, the number of significant figures to use in the calculation, and it’s 3 (0.xxx) by default.
The Percentile function returns the value of the 50th percentile whereas the Percentrank uses the value to return the percentile.
How to Use PERCENTRANK.INC Function in Google Sheets
The PERCENTRANK.INC function in Google Sheets returns the percentage rank of a value in a dataset (0 to1, inclusive).
Both PERCENTRANK and PERCENTRANK.INC would return the same output and both are actually the same. So you can use either of the one.
See the PERCENTRANK.INC Function Syntax:
PERCENTRANK.INC(data, value, [significant_digits])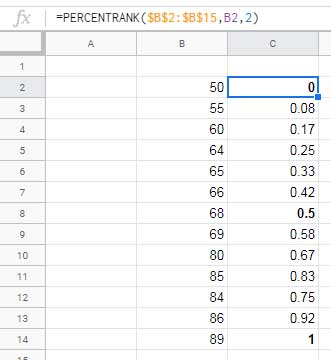
In the above PERCENTRANK/PERCENTRANK.INC formula in cell C2, I have used the value 50 (cell B2) to determine its percentage rank in the dataset in B2
When I drag that formula down, the data remains the same but the value changes.
As you can see the smallest value in the data gets the percent rank 0 and the highest one the percent rank 1 (0 to 1 inclusive).
How to Use PERCENTRANK.EXC Function in Google Sheets
Syntax:
Here also the arguments are the same.
PERCENTRANK.EXC(data, value, [significant_digits])The PERCENTRANK.EXC function in Google Sheets returns the percentage rank of a value in a data set (0 to1, exclusive).
The below PERCENTRANK.INC vs PERCENTRANK.EXC output comparison can hopefully clear your doubts.
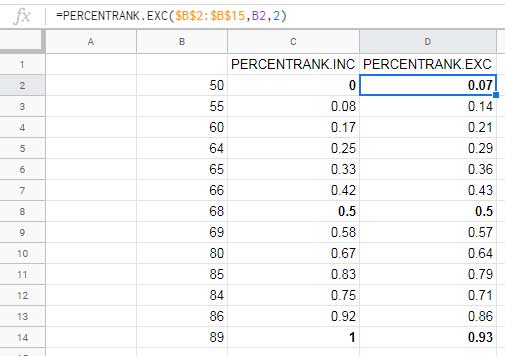
In both inclusive and exclusive percentage ranks in Sheets, when the “value” does not match one of the values in the dataset, the function interpolates to return the correct percentage rank.
I am concluding this tutorial on Percentrank Functions in Google Sheets here. Thanks for the stay. Enjoy!