


")


")

")
")
 in Excel & Google Sheets")


The VARP function in Google Sheets calculates the variance of an entire population, a key statistical measure of how spread out values are in a dataset.
In statistics, population variance is commonly represented as σ² (sigma squared). If you’re working with a complete dataset (i.e., every member of the group), use VARP or VAR.P—both return the same result in Google Sheets.
VARP vs VAR.P in Google Sheets
Google Sheets offers four functions for calculating population variance:
| Function | Category | Description |
|---|---|---|
| VARP | Statistics | Legacy function for calculating population variance. |
| VAR.P | Statistics | Modern equivalent of VARP; automatically converts to VARP in Sheets. |
| VARPA | Statistics | Like VARP, but includes text and Boolean values in the calculation. |
| DVARP | Database | Use with structured (tabular) data and conditions via field headers. |
While VAR.P is the newer version, Google Sheets automatically converts it to VARP when entered—so both are functionally identical.
Syntax and Arguments of VARP and VAR.P Functions
VARP and VAR.P Function Syntax
VARP(value1, [value2, …])
VAR.P(value1, [value2, …])
Arguments:
value1: The first number, range, or array representing the population.value2: Optional. Additional numbers, ranges, or arrays to include.
You can input individual values or entire ranges. If only one value is entered, the function returns a #DIV/0! error.
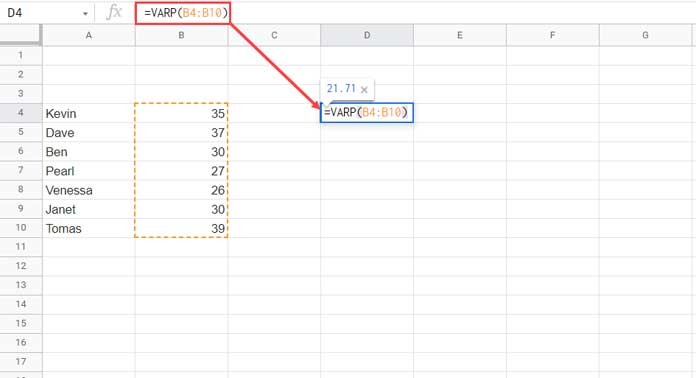
Example: Calculate Population Variance in Google Sheets
Imagine you have the ages of 7 people in range B4:B10. You want to find the population variance:
=VARP(B4:B10)Or:
=VAR.P(B4:B10)Output: 21.71
Both formulas return the same result, and Google Sheets will display it as VARP(...).
Understanding the Population Variance Calculation
Let’s break down how population variance is calculated behind the scenes, using formulas in the spreadsheet:
Step-by-step (Assume values are in B4:B10):
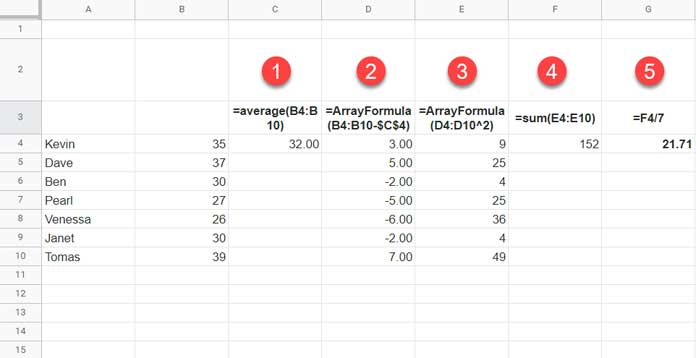
- Find the mean (average)
=AVERAGE(B4:B10) - Subtract the mean from each value
=ArrayFormula(B4:B10 - C4) - Square each result
=ArrayFormula(D4:D10^2) - Sum the squared differences
=SUM(E4:E10) - Divide by number of items (N)
=F4 / 7
This step-by-step helps you better understand the output from the VARP function.
How Google Sheets Handles Blanks, Text, and Boolean Values in VARP
When using the VARP function with different data types like blank cells, text, or logical values, Google Sheets handles them differently depending on whether they’re passed by reference (via a range) or directly within the formula. The examples below illustrate the differences.
When you pass a range into VARP, Google Sheets handles non-numeric values as follows:
- Blank cells: Ignored
- Text values: Ignored
- Boolean TRUE/FALSE: Ignored
- Error values: The function returns the first error it encounters
However, when values are hardcoded, behavior changes:
Formula Example 1:
=VARP(35, 37, TRUE, 27, , 26, 30, 39)- Here,
TRUEis treated as1, and the blank is treated as0.
Formula Example 2:
=VARP(35, 37, 27, 26, 30, 39)These will return different results because of how Boolean and blank values are treated when directly input in the formula.
Final Thoughts on VARP / VAR.P in Google Sheets
Use VARP (or VAR.P) when you’re working with an entire population, not just a sample. If you’re analyzing sample data, switch to VAR.S instead.
And remember—while VAR.P is the newer name, Google Sheets still processes it as VARP for compatibility.