")
")


")


")

")
")
 in Excel & Google Sheets")


When working with datasets that include numbers, text, and logical values, most standard deviation functions in Google Sheets ignore non-numeric entries. But what if you actually want those values considered? That’s where the STDEVPA function becomes useful.
The STDEVPA function is unique because it treats text as 0 and evaluates Boolean values (TRUE as 1, FALSE as 0). This makes it different from other population SD functions such as STDEVP or STDEV.P.
In this guide, we’ll cover:
- The difference between STDEVP and STDEVPA
- Syntax and arguments of STDEVPA
- How STDEVPA treats text, Boolean, blanks, and errors
- A step-by-step breakdown of how to calculate population standard deviation manually
Standard Deviation Functions in Google Sheets
(Overview of STDEVPA, STDEVP, STDEVA, and more)
Google Sheets has 10 standard deviation functions (5 for population, 5 for sample). Here’s a quick summary:
| Function | Type | Remarks |
|---|---|---|
| DSTDEV | Sample | Database function |
| DSTDEVP | Population | Database function |
| STDEV | Sample | Older version, now replaced |
| STDEVP | Population | Older version, now replaced |
| STDEV.S | Sample | Modern equivalent of STDEV |
| STDEV.P | Population | Modern equivalent of STDEVP |
| STDEVA | Sample | Treats text as 0 |
| STDEVPA | Population | Treats text as 0 |
| SUBTOTAL(7/107) | Sample | Skips hidden rows |
| SUBTOTAL(8/108) | Population | Skips hidden rows |
👉 For detailed explanations of these and other related functions, please refer to my Google Sheets Functions Guide
Both STDEVA (sample) and STDEVPA (population) are unique because they interpret text as 0, TRUE as 1, and FALSE as 0 — unlike the other standard deviation functions which ignore text and logical values.
- Text =
0 - TRUE =
1 - FALSE =
0
STDEVPA Syntax
STDEVPA function syntax in Google Sheets:
STDEVPA(value1, [value2, …])- value1 → First value or range in the population
- value2… → Additional values or ranges
How STDEVPA Works (Key Features)
- Text is treated as 0 →
"Apple"becomes0 - Booleans are converted →
TRUE=1,FALSE=0 - Empty cells ignored
- Errors break the formula
STDEVPA Formula Examples
Let’s say you’re tracking your daily step count for a week. Some days you forgot your fitness tracker, so you simply wrote "Absent" in the sheet.
Here’s the data:
| Week | Daily Step Count |
| Mon | 10500 |
| Tue | 9800 |
| Wed | 11200 |
| Thu | Absent |
| Fri | 10200 |
| Sat | 9950 |
| Sun | Absent |
Step 1: Apply STDEVPA
In an empty cell, enter:
=STDEVPA(B2:B8)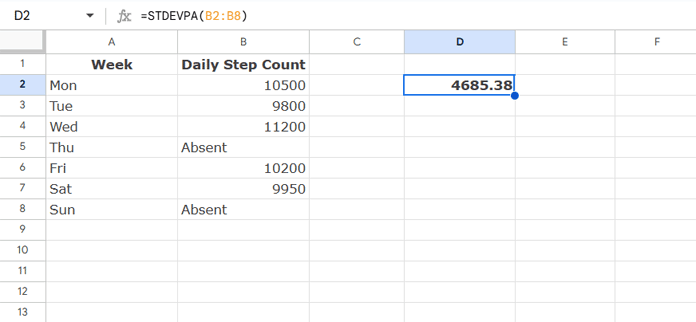
STDEVPAincludes all values in the range.- Numbers are used as-is.
"Absent"(text) is treated as 0.- Boolean values would be treated as
TRUE = 1,FALSE = 0.
So in this case, "Absent" days are being counted as zero steps.
Step 2: Compare with STDEVP
If you enter:
=STDEVP(B2:B8)- Text values (like
"Absent") are ignored. - Only the actual numeric step counts are used.
Why the Results Differ
STDEVPAassumes missing or text entries represent real values (0) → spreads the dataset more → larger standard deviation.STDEVPassumes missing or text entries don’t exist → uses fewer values → smaller standard deviation.
✅ This makes STDEVPA useful when you want to treat non-numeric entries as part of the population (e.g., “no activity days” = 0 steps).
❌ If you want to ignore such entries, stick to STDEVP.
Manual Population Standard Deviation Calculation in Google Sheets
To better understand what STDEVPA does, let’s calculate step by step using the range B2:B8:
- Find the average (C2) using
AVERAGEA:=AVERAGEA(B2:B8)
UnlikeAVERAGE,AVERAGEAtreats text as0,TRUEas1, andFALSEas0, which is exactly howSTDEVPAworks. - Square the differences (D2):
=ArrayFormula(SUM((N(B2:B8)-C2)^2))
TheNfunction converts values in the range into numbers following the same logic (text = 0,TRUE = 1,FALSE = 0). - Find the variance (E2):
=D2/COUNTA(B2:B8)
Here we useCOUNTAinstead ofCOUNTbecauseSTDEVPAincludes text and logical values in its population size. UsingCOUNTwould ignore them, leading to a mismatch. - Take the square root (F2):
=SQRT(E2)

This matches STDEVPA(B2:B8), since both follow the same rules for handling text, logical values, and population size.
STDEVP vs STDEVPA: What’s the Difference?
- STDEVP / STDEV.P → Ignores text and Boolean values
- STDEVPA → Converts text to
0and Boolean values to1/0
👉 Use STDEVPA when you want to include text and logical values in your dataset.
👉 Use STDEVP/STDEV.P if you only want numeric data considered.
Conclusion
The STDEVPA function in Google Sheets is best when your dataset has text, Boolean, or mixed values that you want treated consistently. If you only need numeric data, use STDEV.P instead.
Related tutorials you may find useful: