")
")


")


")

")
")
 in Excel & Google Sheets")


A monthly expense tracker in Google Sheets helps you record daily expenses, analyze spending habits, and stay within your budget. This free Google Sheets expense tracker template automatically summarizes your transactions, displays charts, and shows spending trends through an interactive dashboard.
Because the template is cloud-based, you can access it anytime from desktop, laptop, tablet, or mobile.
Managing personal finances becomes much easier with this monthly expense tracker template in Google Sheets. It allows you to track expenses, analyze spending categories, and optionally compare them against your spending limits.
Instead of paying for complicated budgeting apps, you can use this simple expense tracker spreadsheet that automatically organizes your data.
Monthly Expense Tracker Template Download
Features of the Monthly Expense Tracker Template
This Google Sheets expense tracker template includes several useful features:
- Easy expense entry table
- Customizable expense categories
- Automatic monthly dashboard
- Expense vs budget comparison chart
- Category spending visualization
- Daily expense trend chart
- Calendar heatmap showing spending activity
These features make it easier to analyze spending habits and understand where your money goes every month.
Understanding the Monthly Expense Tracker Template
The template contains five tabs:
Dashboard
Displays a summary of your expenses along with charts and visual insights.
Expenses
Where you enter your daily expense transactions.
Categories
Used to create and manage the expense categories used in the Expenses sheet.
Settings
Controls dashboard reporting and contains payment methods used in the Expenses sheet.
Helper
This sheet is used internally to summarize data for the dashboard.
Let’s start with the Settings sheet.
Settings Sheet
The Settings sheet controls how the monthly expense tracker template works.
It contains two sections. One controls the dashboard reporting, and the other creates the dropdown list for payment methods used in the Expenses sheet.
Section 1 — Dashboard Settings
Select the month in cell C8 and the year in cell C9 for which you want the dashboard to generate reports.
Next, enter the currency symbol in cell C10.
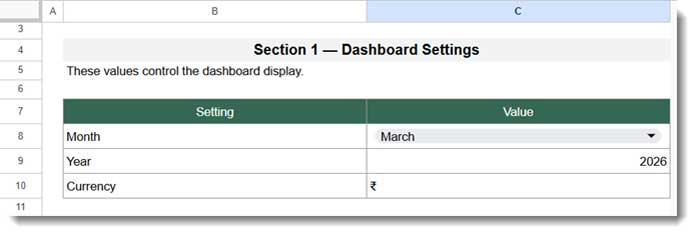
The template currently uses ₹ (Indian Rupee), but you can replace it with your preferred currency symbol.
Here are some popular currency symbols you can use. You can copy and paste any of these into the currency field:
₹
$
€
£
¥
₩
₽
₺
฿
₱
If your currency symbol is not listed above, you can search online and copy the symbol.
The currency symbol does not affect any calculations. It is only used in labels and headings on the dashboard.
Section 2 — Payment Methods
Below this section, you will see a table containing popular payment methods.
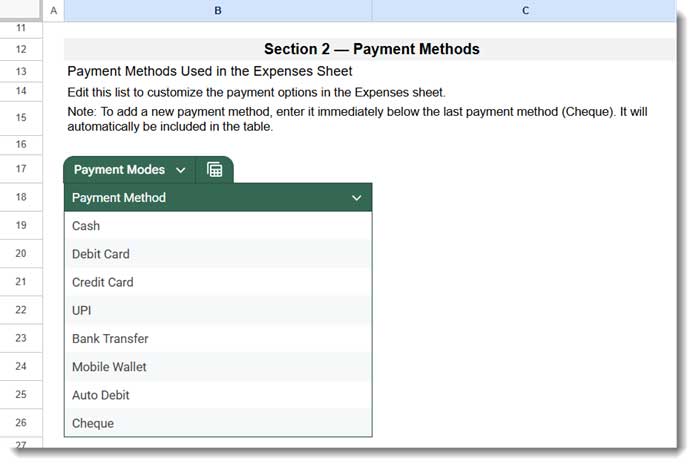
You can modify the existing methods or add new ones according to your preference.
These payment methods are used in the Expenses sheet to create a dropdown menu, allowing you to record how each expense was paid (for example, Cash, UPI, Credit Card, etc.).
Categories Sheet
The Categories sheet is used to define all your expense categories and their monthly budget limits.
The table contains two columns:
- Category – The name of the expense category (for example, Groceries, Travel, Fuel, etc.).
- Budget Limit – The maximum amount you plan to spend for that category in a month.
These budget limits are used on the dashboard to compare your actual expenses with your planned spending.
Using fewer categories generally makes the dashboard easier to read and analyze.
The template already includes a list of sample categories. You can modify them or use them as they are.
If you want to add a new category, simply enter it below the last category in the table, and it will automatically be included.
These categories are also used to create the dropdown menu in the Expenses sheet, allowing you to quickly select the appropriate category when entering your expenses.
Expenses Sheet
After setting up the Settings and Categories sheets, navigate to the Expenses sheet.
This is where you will record your daily expenses.
You will see some sample data in the sheet. You can delete it, except for the data in the last column, because it contains formulas.
To delete the sample entries:
Select A7:E22 and press the Delete key on your keyboard.
Fields in the Expenses Table
Date
Enter the date of the transaction.
Category
Choose the expense category from the dropdown list. All categories entered in the Categories sheet will be available for selection.
Description
Enter a description of the expense. This field is optional but useful for long-term tracking.
Payment Method
Select the payment method used for the transaction. The dropdown list uses data from the Settings sheet.
Amount
Enter the amount spent.
Year-Month (Auto-Calculated)
This column is generated using a formula and does not require any manual changes.
How to Use the Monthly Expense Tracker Template
Once you set up your categories and payment methods, you can start entering expenses in the Expenses sheet.
For best results, record expenses as soon as they occur. This reduces the chance of forgetting transactions later.
In the Settings sheet, select the month you want to analyze. The Dashboard will automatically update to show reports for that month.
Monthly Expense Tracker Dashboard in Google Sheets
At the top of the Dashboard, you will see a quick summary of your expenses, including:
- Total expenses for the selected month
- Total number of transactions
- Highest expense category
- Average daily expense
These indicators help you quickly understand your overall spending behavior.
Keep in mind that some months may show higher average daily expenses if you make large one-time payments such as annual subscriptions or major purchases.
Expense Charts
Below the summary section, you will find two charts displayed side by side:
- A pie chart showing expenses by category
- A line chart displaying your daily spending trend
These charts help you visually understand how your spending changes over time.
Expense vs Budget Comparison
Below the charts, there is a column chart that compares your expense limit vs actual spending.
On the right side of this chart, you will see a summary table listing:
- Category
- Total expenses
The table is sorted in descending order, making it easy to identify your top spending categories.
Expense Calendar Heatmap
One of the most interesting features of this free monthly expense tracker template for Google Sheets is the calendar heatmap.
It displays your selected month’s expenses in a calendar grid, where each day is shaded based on the amount spent.
Darker shades indicate higher spending, while lighter shades represent lower spending days.
This visual layout makes it easy to identify spending patterns throughout the month.
If you want to understand how this visualization works, see my tutorial on creating a calendar heatmap in Google Sheets.
Who Should Use This Monthly Expense Tracker
This Google Sheets expense tracker template is useful for:
- Individuals tracking personal expenses
- Families managing monthly budgets
- Freelancers monitoring spending
- Students tracking daily expenses
- Anyone who prefers spreadsheet budgeting instead of mobile apps
FAQ
Is this monthly expense tracker free?
Yes. This Google Sheets expense tracker template is completely free. Simply make a copy of the template and start entering your expenses.
Can I customize the expense categories?
Yes. You can easily add, remove, or modify categories in the Categories sheet, and the dropdown list in the Expenses sheet will update automatically.
Does the template work on mobile?
Yes. Since it runs in Google Sheets, you can update your expenses from any device, including smartphones and tablets.
Conclusion
This monthly expense tracker template in Google Sheets provides a simple yet powerful way to monitor your spending.
With features like category tracking, expense summaries, charts, and a calendar heatmap, the template helps you understand your spending habits and stay within your budget.
Because it runs entirely in Google Sheets, you can access and update your expense data anytime from any device.
Make a copy of the template, customize it according to your needs, and start tracking your expenses today.