


")


")

")
")
 in Excel & Google Sheets")


Track your multi-unit inventory in Google Sheets using a single dynamic formula. While functions like SUMIF or SCAN can create running balances, they don’t handle products sold in both packs and loose units. This tutorial shows how to build an inventory tracker with unit conversion in Google Sheets that manages pack-to-each conversions automatically — ideal for wholesalers and resellers alike.
👉 Related: If you prefer Excel, check out my companion tutorial — Cumulative Inventory Balance in Excel: Single Formula for Grouping & Multi-Unit Handling. It uses the same logic to calculate group-wise running balances and handle multi-unit inventory directly in Excel.
To set up this tracker, you’ll need two simple tables.
The first one — Inventory Movements (Pack, Inner, Each) — is where you record all stock movements. It tracks what comes in, what goes out, and any adjustments, whether in full packs or individual units.
The second one — Pack-to-Each Conversion Table — defines how your product units relate to each other. For instance, one pack of Smartphone Screen Protector might include 5 inner boxes, and each box might hold 10 screen protectors, which means there are 50 units per pack.
Once you have these tables ready, the formula can automatically calculate your cumulative balances for each product and lot — converting and combining pack and loose quantities in real time. It’s a smart, flexible setup that handles multi-unit inventory just like a dedicated inventory app, but entirely inside Google Sheets.
How to Use the Inventory Tracker with Unit Conversion in Google Sheets
You can start by downloading the ready-to-use template below:
Download Multi-Unit Inventory Tracker
The file contains three sheet tabs:
- Pack-to-Each Conversion
- Inventory Movements
- Closing Balances
Begin with the Pack-to-Each Conversion sheet. Once you finish entering your product data there, move to Inventory Movements, where all the key calculations take place.
Pack-to-Each Conversion Table
In this sheet, list only your unique products — not every stock entry — along with their packaging details.
Here’s a sample dataset (range B3:E):
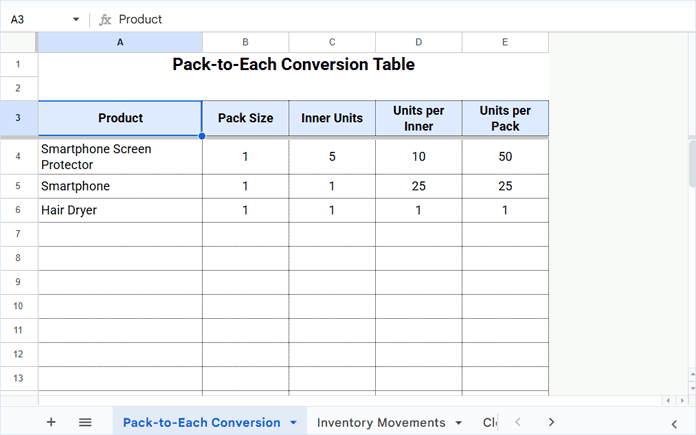
Let’s go through each example so you can enter your own products correctly and ensure the tracker works as intended:
- Smartphone Screen Protector – One pack contains 5 inner units, and each inner unit has 10 protectors, giving 50 units per pack.
- Smartphone – One pack directly contains 25 smartphones, with no inner units. In such cases, enter
1for Pack Size and Inner Units (not0), and25for Units per Inner. - Hair Dryer – Sold as a single item per pack. Enter
1for Pack Size, Inner Units, and Units per Inner.
The Units per Pack column is calculated automatically using a formula, so you don’t need to modify anything in column E.
This conversion table helps the tracker convert pack quantities into loose (each) units later in the Inventory Movements sheet, allowing accurate handling of mixed-unit transactions.
Inventory Movements
This is where you’ll record all stock transactions — incoming, outgoing, and adjustments.
⚠️ Important: Once you start entering data in Inventory Movements, avoid changing any existing values in the Pack-to-Each Conversion sheet. You can add new products later, but don’t modify existing entries.
Here’s a sample dataset (range A3:K):

Notes:
- Enter incoming quantities as positive values.
- Enter outgoing quantities as negative values.
- The Pack Balance and Each Balance columns (columns J and K) are auto-calculated using formulas.
Example Breakdown
- Smartphone Screen Protector (Lot SP-01)
- Received 5 packs on Sept 21.
- Sold 4 packs and 40 loose items → balance = 10 units.
- Adjusted 10 missing units → final balance = 0.
- On Sept 22, received a return of 5 units → balance = 5.
- Sold all 5 on Sept 24 → balance = 0.
- A new lot (SP-02) arrived the same day — 1 pack and 10 loose units — sold the same day → balance = 0.
- Hair Dryer (Lot HD-01)
- Received 5 packs (5 units) on Sept 25.
- Sold 4 units → balance = 1.
This is how the Multi-Unit Inventory Tracker in Google Sheets works — accurately tracking stock across multiple units and lots.
Closing Balances
The Closing Balances sheet is an automatically generated summary of items that still have stock remaining at the end of your recorded transactions.
It lists only those product lots from the Inventory Movements sheet that have a non-zero balance — helping you quickly see what’s left in stock.
Here’s a sample dataset (range A3:E):
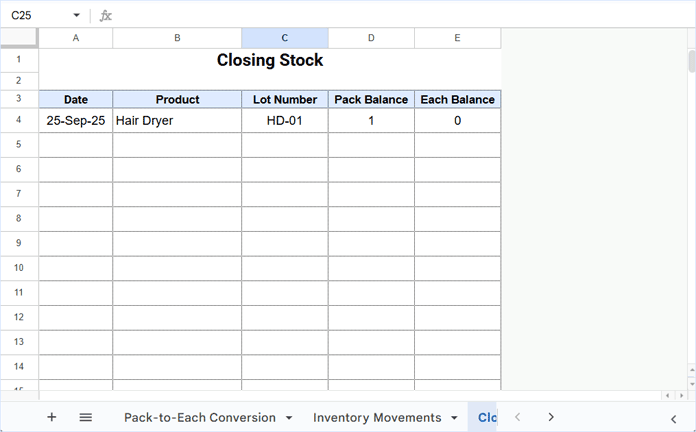
You don’t need to enter anything manually in this sheet.
An array formula placed in cell A3 automatically pulls and displays the current closing balances based on your Inventory Movements data.
This sheet serves two purposes:
- Quick Summary – Provides a clean view of your remaining stock by product and lot.
- Performance Maintenance – Over time, if your Inventory Movements table grows large, functions like
SCANandLAMBDAmay cause the sheet to slow down slightly. To maintain performance, you can reset the tracker periodically using this sheet.
Here’s how to do it safely:
- Make a backup copy of your file (File ▸ Make a copy).
- In your main file, clear the contents in columns A4:I of the Inventory Movements table.
- Go to your backup file’s Closing Balances sheet.
- Copy the closing balances from there and paste them as opening balances in your main file’s Inventory Movements table.
- That means Pack Balance → Pack In and Each Balance → Each In.
This simple step resets your tracker for the next tracking cycle while preserving accurate opening balances.
Next, let’s look at the formulas that power the tracker and make all this automation possible.
Formulas Powering the Multi-Unit Inventory Tracker in Google Sheets
This Multi-Unit Inventory Tracker in Google Sheets relies on two main formulas, plus one optional formula for closing balances:
- One in the Pack-to-Each Conversion sheet to calculate the Units per Pack.
- One in the Inventory Movements sheet to calculate the whole and loose balances.
- (Optional) One in the Closing Balances sheet to list only those product lots that still have remaining stock.
Let’s go through them one by one.
Formula in the Pack-to-Each Conversion Table
In cell E3, there is an array formula:
=ArrayFormula(VSTACK("Units per Pack", LET(calc, C3:C*D3:D, IF(calc=0,,calc))))Explanation:
- Multiplies Inner Units (column C) by Units per Inner (column D).
- Automatically adds a header
"Units per Pack". - Returns the total units for each product in the table.
Formula in the Inventory Movements Table
In cell J3, there’s a more advanced formula that calculates both whole and loose balances for all stock movements automatically:
=ArrayFormula(LET(
  data, B4:I,
  lCol, FILTER('Pack-to-Each Conversion'!A4:A, 'Pack-to-Each Conversion'!A4:A<>""),
  rCol, FILTER('Pack-to-Each Conversion'!E4:E, 'Pack-to-Each Conversion'!A4:A<>""),
  seq, SEQUENCE(ROWS(data)),
  dataS, SORT(HSTACK(data, seq), 1, 1, 2, 1),
  prd, CHOOSECOLS(dataS, 1),
  lot, CHOOSECOLS(dataS, 2),
  whole, CHOOSECOLS(dataS, 3)+CHOOSECOLS(dataS, 5)+CHOOSECOLS(dataS, 7),
  loose, CHOOSECOLS(dataS, 4)+CHOOSECOLS(dataS, 6)+CHOOSECOLS(dataS, 8),
  sKey, prd&lot,
  lkp, XLOOKUP(prd, lCol, rCol),
  header, HSTACK("Pack Balance", "Each Balance"),
  units, SCAN(0, seq, LAMBDA(acc,val,
    LET(
      capture, LAMBDA(col, INDEX(col, val)),
      capturePv, LAMBDA(col, CHOOSEROWS(INDEX(col, val-1), 1)),
      key, capture(sKey),
      balqty, capture(whole*lkp+loose),
      keyPrv, capturePv(sKey),
      IF(key<>keyPrv, balqty, acc + balqty)
    )
  )),
  wBal, INT(units/lkp),
  lBal, MOD(units, lkp),
  VSTACK(header, SORT(IFNA(HSTACK(wBal, lBal),""), CHOOSECOLS(dataS, -1), 1))
))
This is the brain of the Multi-Unit Inventory Tracker.
Formula Explanation – How It Works
The Inventory Movements formula is essentially a group-wise running balance formula that powers the inventory tracker with unit conversion in Google Sheets. It calculates cumulative stock totals that reset automatically whenever the Product or Lot Number changes — ideal for tracking inventory with multiple packaging levels.
What makes this formula unique is that it first converts all whole packs into loose (each) units. This allows all transactions — in, out, and adjustments — to be summed uniformly, ensuring accurate totals regardless of how the stock was recorded.
After calculating the cumulative totals, it converts them back into whole packs and loose units.
Key Formula Components
dataS – Sort data internally
Group-wise running totals with SCAN require sorted data. To handle this automatically, the formula adds a sequence column and sorts the data by Product and Lot. After processing, the sequence helps restore the original order, so you get accurate per-lot balances without manual sorting.
whole – Total of all whole-unit columns (Pack In, Pack Out, Pack Adjustment).
loose – Total of all loose-unit columns (Each In, Each Out, Each Adjustment).
lkp – Looks up the number of loose units per pack from the Pack-to-Each Conversion table.
units – Converts whole units into loose units, combines them, and iterates row by row using SCAN to produce cumulative running balances.
wBal – Converts total units back into whole packs.
lBal – Converts remaining loose units (the remainder) after full packs are counted.
Key Takeaways
- Fully dynamic multi-unit inventory tracking (packs + loose units) — all in one formula.
- Automatically resets balances by product and lot.
- No manual sorting or helper formulas required — everything happens inside the formula.
- Ideal for large datasets and real-time stock management in Google Sheets.
Formula in the Closing Balances Sheet
The following formula in cell A3 automatically generates the stock balances:
=LET(
  fl, HSTACK("Date", "Product", "Lot Number", "Pack Balance", "Each Balance"),
  flip, SORT('Inventory Movements'!A4:K, ROW('Inventory Movements'!A4:A)*('Inventory Movements'!B4:B<>""), 0),
  uq, SORTN(flip, 9^9, 2, 2, 1, 3, 1),
  clBal, CHOOSECOLS(uq, 1, 2, 3, 10, 11),
  VSTACK(fl, SORT(FILTER(clBal, (CHOOSECOLS(clBal, 4)>0)+(CHOOSECOLS(clBal, 5)>0))))
)
It’s a simple but powerful formula. Here’s what each part does:
- flip – Reverses the Inventory Movements table so that the latest transactions appear first.
- uq – Uses the SORTN function to remove duplicates based on Product and Lot Number, keeping only the latest entry of each.
- clBal – Picks only the relevant columns: Date, Product, Lot Number, Pack Balance, and Each Balance.
- fl – Creates the header row for the selected columns.
- VSTACK(…) – Combines the header with the filtered results and sorts them. Only products with non-zero balances (either Pack or Each) are displayed.
FAQs – Multi-Unit Inventory Tracker in Google Sheets
Here are answers to some common questions users have about setting up and maintaining the inventory tracker with unit conversion in Google Sheets.
1. Can I add more products later?
Yes. You can safely add new products to the Pack-to-Each Conversion sheet anytime.
Just make sure not to edit or delete existing rows — the formula depends on consistent product references.
2. What should I do if a product doesn’t have inner units or packs?
For single-unit products, set Pack Size = 1, Inner Units = 1, and Units per Inner = 1.
Example:Hair Dryer | 1 | 1 | 1 | 1
This ensures the tracker treats it as a standard single-unit item.
3. My balances show incorrect values — what could be wrong?
Check the following:
- Incoming quantities are positive.
- Outgoing and adjustment quantities are negative.
- Product names match exactly between both sheets (no extra spaces or case mismatches).
4. The sheet feels slow — how can I improve performance?
If your dataset becomes large, formulas using SCAN and LAMBDA may slow down.
To improve speed:
- Make a backup copy of your file.
- In your main file, clear the contents in columns A4:I of the Inventory Movements sheet.
- Copy the closing balances from your backup file’s Closing Balances sheet.
- Paste them as opening balances in your main file (Pack Balance → Pack In, Each Balance → Each In).
5. How often should I reset the tracker?
It depends on your transaction volume. If recalculation starts slowing down, reset it monthly or quarterly using the Closing Balances method above.
6. Can I track extra details like supplier or purchase cost?
Yes. You can add columns such as Supplier, Purchase Date, or Unit Cost in the Inventory Movements sheet.
Just be sure to update the formulas if you shift column positions.
7. What if the packing configuration of a product changes in the future?
Do not edit the existing entry in the Pack-to-Each Conversion table, as it may affect previous calculations.
Instead, add it as a new product entry.
For example, if the product is Hair Dryer, create a new entry named Hair Dryer_New (or any unique variation).
This keeps your historical data accurate while reflecting the updated packing configuration.
Still have questions?
Leave a comment below.
Resources
- Normal and Array Running Totals in Google Sheets
- Array Formula for Conditional Running Total in Google Sheets
- How to Reset a Running Total by Year in Google Sheets
- Running Total by Category in Google Sheets
- How to Reset a Running Total by Month in Google Sheets
- Reset Running Total at Blank Rows in Google Sheets
- Running Total with Multiple Subcategories in Google Sheets