


")


")

")
")
 in Excel & Google Sheets")


This tutorial explains how to calculate Year-on-Year (YoY) growth in Google Sheets from raw data. To do this, you’ll need at least two columns: a date column and an amount column.
It’s quite straightforward if you already have a yearly summary report. But if you want to automate everything directly from raw data, you may face a few challenges:
- Calendar vs Fiscal Years – You’ll need a dynamic formula that can generate yearly summaries based on either calendar years or your company’s fiscal year.
- Gaps in Historical Data – Sometimes there are missing years due to business closures, natural calamities, or situations like a pandemic. Your formula should be flexible enough to handle these gaps.
In this guide, I’ll give you a step-by-step approach to calculate YoY growth in Google Sheets, along with a dynamic formula that can create a Year-on-Year growth table in one go.
Introduction to Year-on-Year (YoY) Growth
Year-on-Year (YoY) growth compares the performance of a specific period with the same period one year earlier. In this tutorial, YoY refers to annual growth — comparing the total value of one full year against the total value of the previous year.
For example:
- If you’re calculating annual YoY, you compare the total for 2025 with the total for 2024.
This makes YoY a powerful metric for analyzing long-term growth trends while eliminating seasonal effects. It helps you answer:
👉 “Are we really growing compared to the previous year, or is this just a seasonal spike?”
Sample Data for YoY Growth Calculation
We’ll use a sample dataset in the following format:
| Date | Amount |
| 01/02/2019 | 2500.00 |
| 01/03/2019 | 1895.00 |
| 01/06/2019 | 1895.00 |
| 01/07/2019 | 1200.00 |
| 01/09/2019 | 1800.00 |
| 01/10/2019 | 1600.00 |
| 01/01/2020 | 3600.00 |
| … | … |
Before moving ahead, make sure your data is sorted by date in ascending order. In Google Sheets, you can do this by selecting the data range (excluding the header row), then clicking Data → Sort range → Sort range by column A (A to Z).
We’ll first create a helper column to mark calendar year or fiscal year. Then we’ll build a yearly summary and finally calculate the Year-on-Year growth.
The sample sheet contains all the formulas used in this tutorial, including fiscal year marking, yearly summary, and YoY growth calculation. Click the button to make your own copy and follow along step by step.
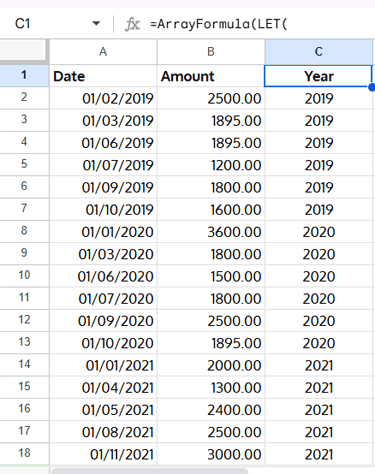
Step 1: Mark Year Based on Calendar or Fiscal Year
In cell C1, enter the following formula:
=ArrayFormula(LET(
  dt, A2:A,
  start, 1,
  fyrs, YEAR(dt)-(MONTH(dt)<start),
  fyre, RIGHT(YEAR(dt)+(MONTH(dt)>=start), 2),
  VSTACK("Year", IF(dt="",,fyrs&IF(start=1,,"-"&fyre)))
))
Replace start (which is 1 by default = January) with your fiscal year start month.
- If fiscal year starts in April → replace
1with4. - If it starts in July → replace
1with7.
The results will show simple years like 2024, 2025, etc., for a calendar year (start = 1) and ranges like 2022-23, 2023-24 for fiscal years.
How it works:
YEAR(dt)-(MONTH(dt)<start)→ Returns the fiscal year start.RIGHT(YEAR(dt)+(MONTH(dt)>=start), 2)→ Returns the fiscal year end.- Combines both into a neat year/fiscal year label.
Step 2: Calculate Yearly Revenue for YoY Growth
Now, let’s create a yearly summary using QUERY.
In cell E1, enter:
=QUERY(B1:C, "SELECT Col2, SUM(Col1) WHERE Col1 IS NOT NULL GROUP BY Col2 LABEL SUM(Col1) 'Revenue'", 1)This gives you:
- Year in one column
- Revenue for that year in another column

Step 3: Calculate Year-on-Year (YoY) Growth in Google Sheets
The general formula for YoY growth is:
YoY Growth=((Current_Year's_Value / Previous_Year's_Value) − 1)×100But since there may be gaps in the dataset, we’ll use a formula that checks if years are consecutive.
In cell G2, enter and drag down:
=IFERROR(
  IF(
    VALUE(MID(E1, 1, 4))=VALUE(MID(E2, 1, 4))-1,
    (F2/F1)-1,
    "N/A - Gap in Data"
  ), "-"
)- Extracts the first 4 digits of the year (works even with fiscal years like
2019-20). - Checks if the years are consecutive.
- If yes → calculates YoY growth.
- If no → returns
"N/A - Gap in Data".
Finally, format the column as Percentage (Format > Number > Percentage).

Step 4: Dynamic YoY Growth Table with All-in-One Formula
To build the YoY growth table in one go, use this dynamic array formula:
=LET(
  qry, QUERY(B2:C, "SELECT Col2, SUM(Col1) WHERE Col1 IS NOT NULL GROUP BY Col2 LABEL SUM(Col1)''"),
  yr, CHOOSECOLS(qry, 1),
  amt, CHOOSECOLS(qry, 2),
  YoY,
    MAP(
      SEQUENCE(ROWS(yr)),
      LAMBDA(x,
         IFERROR(
           IF(
             VALUE(MID(CHOOSEROWS(yr, x-1), 1, 4))=VALUE(MID(CHOOSEROWS(yr, x), 1, 4))-1,
             (CHOOSEROWS(amt, x)/CHOOSEROWS(amt, x-1))-1,
             "N/A - Gap in Data"
           ), "-"
         )
      )
    ),
  VSTACK(HSTACK("Year", "Revenue", "YoY Growth"), HSTACK(qry, YoY))
)
This formula:
- Summarizes yearly revenue with
QUERY. - Maps YoY growth automatically year by year.
- Stacks everything into a clean, ready-to-use YoY table.

FAQs on YoY Growth in Google Sheets
1. What is the formula for YoY growth in Google Sheets?
The general formula is: YoY Growth=((Current_Year's_Value / Previous_Year's_Value) − 1)×100
In Google Sheets, you can use:
=(Current_Year's_Revenue / Previous_Year's_Revenue) − 1and format the result as a percentage.
2. Should I calculate YoY based on calendar years or fiscal years?
It depends on your business:
- Calendar YoY (Jan–Dec) → Compare the total for 2025 with the total for 2024.
- Fiscal YoY → Compare the total for your fiscal year (e.g., Apr 2024–Mar 2025) with the previous fiscal year (Apr 2023–Mar 2024).
3. What if I have missing years in my data?
No problem. The formulas in this guide handle gaps. If a year is missing, you’ll see "N/A - Gap in Data" instead of a wrong calculation.
4. Can I use Pivot Tables to calculate YoY growth in Google Sheets?
Pivot Tables are great for creating summaries, but they can’t directly calculate YoY growth across years. That’s why using QUERY + formulas (as shown in this tutorial) is more flexible.
5. Is YoY growth the same as CAGR?
No.
- YoY growth → Compares one year with the previous year.
- CAGR (Compound Annual Growth Rate) → Measures the average growth rate across multiple years.
For example, if revenue grows from $1M in 2020 to $2M in 2025, CAGR smooths out the growth rate across 5 years, while YoY shows the change each year.
In Google Sheets, you can calculate CAGR using the RRI function. For details, see our guide: How to Use the RRI Function in Google Sheets.
6. Why is YoY growth important?
Because it helps you answer:
- Are we growing compared to last year?
- Or is this just a seasonal peak (like Diwali or Christmas sales)?
YoY is preferred by investors, managers, and financial analysts because it highlights genuine performance trends, filtering out short-term fluctuations that monthly figures can exaggerate.