


")


")

")
")
 in Excel & Google Sheets")


If you use Google Sheets as a hotel booking system—similar to our Reservation and Booking Status template—you may want to calculate the hotel occupancy rate in Google Sheets.
In such a system, you typically have a check-in date column and a check-out date column. When calculating the hotel occupancy rate from these date ranges, you must take extra care not to treat the check-out date as inclusive. This is a very common mistake and can lead to incorrect results.
The issue becomes more noticeable when a booking spans across two months and you want to calculate the occupancy rate for a specific month. If the logic is wrong, your occupancy numbers will be inflated.
Before we get into the Google Sheets formulas, let’s first understand what hotel occupancy rate actually means.
What Is Hotel Occupancy Rate?
The hotel occupancy rate shows the percentage of available room nights that are booked during a given day, month, or any other period (for example, today or last month).
The basic formula to calculate occupancy rate is:
Occupancy Rate = (Number of room nights occupied ÷ Total available room nights) × 100
Where:
Total available room nights = Total number of rooms × Number of days in the selected period
Example
If you have 10 rooms and a total of 38 room nights booked during September 2025, the occupancy rate would be:
38 ÷ (10 × 30) × 100 = 12.67%
In the next section, we’ll walk through a step-by-step method to calculate the hotel occupancy rate in Google Sheets using check-in and check-out date columns, while correctly handling date ranges and month boundaries.
Sample Data for Occupancy Rate Calculation
The sample data below represents a typical hotel booking table in Google Sheets. It includes the room number, room type, guest name, check-in date, and check-out date.
| Room # | Room Type | Booked By | Check-In Date | Check-Out Date |
|---|---|---|---|---|
| F101A | Suite | Casey | 15/09/2025 | 18/09/2025 |
| F101A | Suite | Julia | 18/09/2025 | 25/09/2025 |
| F101A | Suite | Ben | 26/09/2025 | 27/09/2025 |
| F101A | Suite | Harry | 01/10/2025 | 10/10/2025 |
| F102A | Suite | Ahsan | 01/09/2025 | 05/09/2025 |
| S301A | Queen | Aleena | 06/09/2025 | 08/09/2025 |
| S202A | Queen | Andrea | 08/09/2025 | 14/09/2025 |
| T302B | King | Patrick | 05/09/2025 | 20/09/2025 |
| S301A | Queen | Frank | 20/10/2025 | 28/10/2025 |
| S301A | Queen | Peter | 04/11/2025 | 08/11/2025 |
For the occupancy rate calculation in Google Sheets, we only need the check-in and check-out date columns. The other columns are included for context and realism, and they also serve as additional filters if required.
Also note that, in this example, the total number of rooms available for booking is 10.
Formula to Calculate Occupancy Rate for a Specific Day in Google Sheets
First, specify the date for which you want to calculate the hotel occupancy rate.
Step 1: Enter the Date
- Enter the date in cell G1
- To calculate yesterday’s occupancy rate:
=TODAY()-1 - To calculate today’s occupancy rate:
=TODAY()
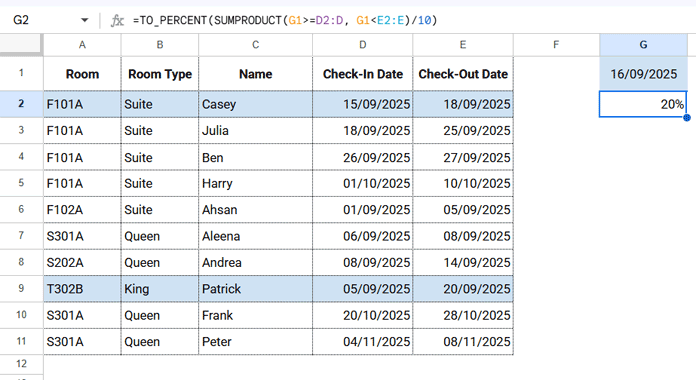
For this example, manually enter 16/09/2025 in cell G1.
Step 2: Enter the Formula
Enter the following formula in another cell, for example G2:
=TO_PERCENT(SUMPRODUCT(G1>=D2:D, G1<E2:E)/10)This formula returns the hotel occupancy rate in Google Sheets for the specified date.
Based on the sample data, the result will be 20%.
How the Daily Occupancy Formula Works
G1 >= D2:Dchecks whether the selected date is on or after the check-in dateG1 < E2:Eensures the check-out date is excluded, which is critical for accurate occupancy calculation- SUMPRODUCT counts how many rooms are occupied on that day
- Dividing by
10represents the total number of available rooms - TO_PERCENT converts the result into a percentage
This approach avoids one of the most common mistakes when calculating hotel occupancy rate in Google Sheets—treating the check-out date as an occupied night.
Formula to Calculate Occupancy Rate for a Specific Month or Period in Google Sheets
The following formula calculates the hotel occupancy rate in Google Sheets for a specific date range. You can use it for a month, quarter, or any custom period.
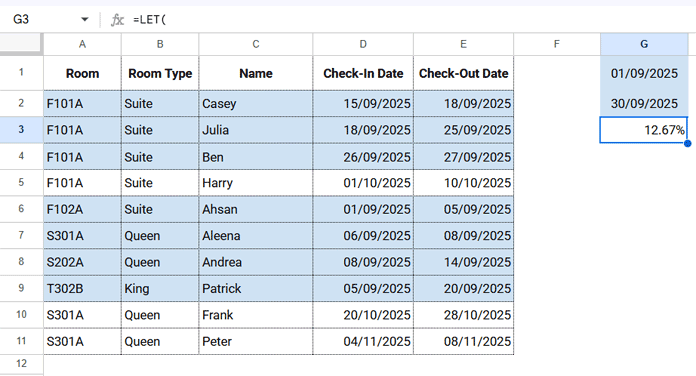
For example, to calculate the occupancy rate for September 2025:
- Start date: 01/09/2025
- End date: 30/09/2025
Step 1: Specify the Date Range
- Enter the start date in cell G1
- Enter the end date in cell G2
Step 2: Enter the Formula
Enter the following formula in cell G3:
=LET(
  ci, D2:D,
  co, E2:E,
  s, G1,
  e, G2,
  TO_PERCENT(
    SUMPRODUCT(
      IF(
        (ci <= e) * (co > s),
        IF(co > e + 1, e + 1, co) - IF(ci < s, s, ci),
        0
      )
    ) / (10 * (DAYS(e, s) + 1))
  )
)
Result
Based on the sample data, this formula returns an occupancy rate of 12.67% for September 2025.
You can use the same approach for longer periods, such as:
- Quarter 1: 01/01/2025 to 31/03/2025
- Any custom date range
How the Date-Range Occupancy Formula Works
(ci <= e) * (co > s)identifies bookings that overlap with the selected periodIF(co > e + 1, e + 1, co)
Caps the check-out date if the booking extends beyond the selected periodIF(ci < s, s, ci)
Adjusts the check-in date if the booking starts before the selected period- The occupied nights are calculated as:
Adjusted Check-Out − Adjusted Check-In SUMPRODUCTadds up all occupied room nights10 * (DAYS(e, s) + 1)calculates total available room nightsTO_PERCENTconverts the final value into a percentage
This method ensures accurate results even when bookings span multiple months—one of the hardest parts of calculating hotel occupancy rate in Google Sheets.
What if I want to Calculate the Occupancy Rate of Specific Rooms or Types of Rooms?
You may want to calculate the occupancy rate only for specific rooms or specific room types.
For example, you might have Suite, King, and Queen rooms and want to calculate the occupancy rate for:
- Only King rooms
- King and Queen rooms combined
- A specific room number such as F101A
In such cases, you can modify the formula by adding an XMATCH condition.
Example
Assume you have 10 rooms in total, out of which 7 rooms are King and Queen. You now want to calculate the occupancy rate for only those 7 rooms.
In both formulas, include the following array inside SUMPRODUCT:
ISNUMBER(XMATCH(B2:B, VSTACK("King", "Queen")))This checks whether the room type matches the specified list and returns TRUE or FALSE.
Single-Day Occupancy Rate Formula
=TO_PERCENT(
  SUMPRODUCT(
    G1 >= D2:D,
    G1 < E2:E,
    ISNUMBER(XMATCH(B2:B, VSTACK("King", "Queen")))
  ) / 7
)
Date-Range Occupancy Rate Formula
=LET(
  ci, D2:D,
  co, E2:E,
  s, G1,
  e, G2,
  TO_PERCENT(
    SUMPRODUCT(
      IF(
        (ci <= e) * (co > s),
        IF(co > e + 1, e + 1, co) - IF(ci < s, s, ci),
        0
      ),
      ISNUMBER(XMATCH(B2:B, VSTACK("King", "Queen")))
    ) / (7 * (DAYS(e, s) + 1))
  )
)
Filtering by Room Number Instead of Room Type
If you want to apply the same logic using room numbers, replace B2:B with A2:A and enter the required room numbers inside VSTACK.
Also, make sure you divide by the total number of matched rooms, not by the total number of rooms in the hotel.
Conclusion
Calculating the hotel occupancy rate in Google Sheets becomes straightforward once you correctly handle check-in and check-out date ranges. The key is to exclude the check-out date, accurately count overlapping bookings, and divide by the correct number of available room nights.
Using the formulas covered in this guide, you can:
- Calculate occupancy for a single day
- Calculate occupancy for a month or any custom period
- Filter occupancy by room type or specific room numbers
This approach works not only for hotels, but also for any business that relies on date-based bookings—such as vacation rentals, equipment rentals, or car rentals.