
 in Google Sheets")

")


")


")


Counting consecutive duplicates in Excel is useful for analyzing patterns, detecting repetitive sequences, and improving data processing efficiency. Using a dynamic array formula that involves the FILTER and SCAN functions, this method provides a spill-based approach that updates automatically when data changes.
Why Count Consecutive Duplicates?
This technique is valuable in various scenarios, such as:
- Tracking Streaks – Identifying how long a value repeats (e.g., sales trends, employee shifts).
- Data Cleaning – Spotting and managing duplicate entries in structured datasets.
- Pattern Recognition – Analyzing repeated sequences in logs, test results, or production data.
- Performance Analysis – Evaluating consecutive wins/losses in sports data or financial trends.
Formula to Count Consecutive Duplicates in Excel
=FILTER(HSTACK(range, SCAN(0, range, LAMBDA(acc, curr, IF(curr=OFFSET(curr, -1, 0), acc+1, 1)))), SCAN(0, range, LAMBDA(acc, curr, IF(curr<>OFFSET(curr, 1, 0), 1, 0))))Where range is the column range you want to analyze and return the results for.
How the Formula Works
- The result includes the first occurrence of each set of duplicates along with its consecutive count in a separate column.
- Since this formula involves SCAN and FILTER, it will only work in Excel versions that support dynamic arrays.
Now, let’s go through an example to see how it works in action.
Example: Tracking Consecutive Work Shifts
Imagine you manage a team and need to track how many consecutive days an employee has worked the same shift before switching. This helps identify work patterns, prevent burnout, and ensure compliance with labor regulations.
Sample Data:
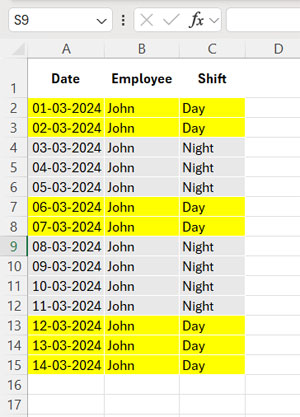
In this example, we apply the formula to the Shift column (C2:C15).
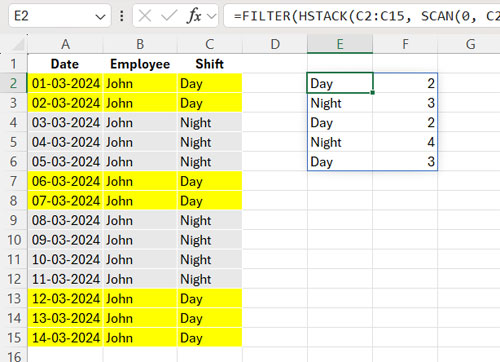
Formula:
=FILTER(HSTACK(C2:C15, SCAN(0, C2:C15, LAMBDA(acc,curr, IF(curr=OFFSET(curr,-1,0), acc+1, 1)))), SCAN(0, C2:C15, LAMBDA(acc,curr, IF(curr<>OFFSET(curr,1,0), 1, 0))))Expected Output:
Formula Breakdown
This formula uses the FILTER function to return only the last occurrence of each duplicate sequence along with its count.
Syntax: FILTER(array, include, [if_empty])
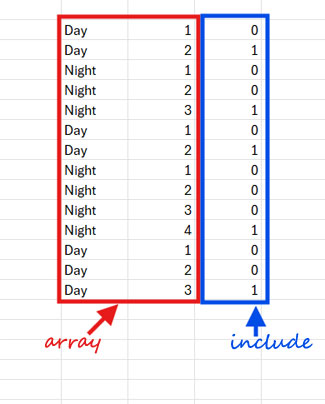
1. array:
HSTACK(C2:C15, SCAN(0, C2:C15, LAMBDA(acc, curr, IF(curr=OFFSET(curr,-1,0), acc+1, 1))))
- Appends a virtual helper column that tracks the running count of consecutive duplicates.
- The SCAN function counts consecutive duplicates.
2. include:
SCAN(0, C2:C15, LAMBDA(acc, curr, IF(curr<>OFFSET(curr,1,0), 1, 0)))
- Returns
1for the last occurrence of each consecutive duplicate and0otherwise.
Finally, the FILTER function extracts only the rows where the second SCAN function returns 1, ensuring only the last row of each duplicate sequence is displayed.
Conclusion
This formula effectively counts consecutive duplicates in Excel using dynamic arrays. Because it leverages SCAN and FILTER, it automatically updates when data changes—making it a modern, flexible alternative to traditional formulas.