Google introduced the Group Rows and Columns feature in Google Sheets in early 2018. But why is this feature useful?
Grouping rows and columns is especially valuable when working with large datasets. It allows you to organize data into collapsible sections, making it easier to focus on specific areas while hiding unnecessary details.
Before this feature, users relied on hiding and unhiding rows or columns, which was more time-consuming and less intuitive.
With grouping, you can also create nested groups for multi-level data structures (e.g., Category > Sub-category). This makes it easier to drill down into detailed data or view high-level summaries. Additionally, you can add group-wise totals using advanced Google Sheets features, mimicking grouping and subtotals in Excel.
How to Group Rows in Google Sheets
Steps to Group Rows:
- Select the rows you want to group — make sure to select the entire rows, not a specific cell range.
- Right-click to open the shortcut menu.
- Click View more row actions.
- Select Group rows.
- A gray bar will appear to the left of the row numbers, with icons (
+for collapsed,-for expanded).
Nested Row Grouping in Google Sheets
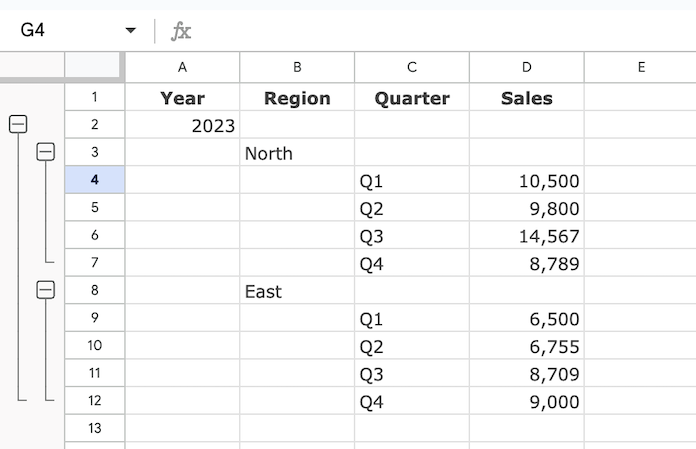
For hierarchical structuring, you need to arrange your data properly, typically with a parent-child structure. Here’s an example:
| A | B | C | D | |
| 1 | Year | Region | Quarter | Sales |
| 2 | 2023 | |||
| 3 | North | |||
| 4 | Q1 | 10,500 | ||
| 5 | Q2 | 9,800 | ||
| 6 | Q3 | 14,567 | ||
| 7 | Q4 | 8,789 | ||
| 8 | East | |||
| 9 | Q1 | 6,500 | ||
| 10 | Q2 | 6,755 | ||
| 11 | Q3 | 8,709 | ||
| 12 | Q4 | 9,000 | ||
| 13 | 2024 |
Steps to Create Nested Groups:
- Select rows 3 to 12 and group them.
- This groups all the rows under 2023.
- Select rows 4 to 7 and group them.
- This groups the North region data under 2023.
- Select rows 9 to 12 and group them.
- This groups the East region data under 2023.
This creates a nested grouping. Note that the header row (row 2) is not included in the grouping, so it remains visible when the groups are collapsed.
How to Ungroup Rows in Google Sheets
Steps to Ungroup Rows:
- Right-click the group indicator (the
+or-icon). - Select Ungroup rows.
Currently, Google Sheets does not support ungrouping all groups at once, so you may need to remove each group individually.
How to Group Columns in Google Sheets
You can group columns using similar steps as grouping rows.
Steps to Group Columns:
- Select the columns you want to group.
- Right-click to open the shortcut menu.
- Click View more column actions.
- Select Group columns.
Unlike rows, a gray bar will appear above the column headers with group indicators (+ for collapsed, - for expanded).
The same approach applies to ungrouping columns: right-click the group indicator and select Ungroup columns.
Key Benefits of Grouping in Google Sheets
- Simplifies navigation in large datasets.
- Keeps your spreadsheet organized and readable.
- Supports hierarchical (nested) grouping for detailed data structures.
- Mimics Excel’s grouping and subtotal functionalities. See the Resources section below for more details.
Using these grouping techniques, you can make your spreadsheets more efficient, visually cleaner, and easier to work with!
Resources
The following resources will be helpful if you want to add subtotals to grouped rows:


If there are protected cells in the column, those without access to edit protected cells cannot expand/collapse grouped rows, am I missing something?
If I have a chart sitting on top of a portion of my grouped rows, is there any way to have that chart disappear when I close that group of rows?
Hi, Mike,
I think that’s not possible.
I am having trouble creating multiple groups. When trying to create 2 separate groups, it just creates one large group.
Hi, Schuyler Bell,
Leave a row between groups.
Once groups are set, it doesn’t appear that you can collapse all and expand all like you can in excel. Is that right?
Hi, Kevin,
You can do that but not like in Excel. Right-click anywhere on the left side of the row numbers and from the shortcut menu that appears choose either of the below options.
1. Expand all row groups.
2. Collapse all row groups.
3. Move +/- button to the bottom.
to alter the position of the (+) sign, right click on the plus sign
I’ve given users comment/view access only. Why can’t they un-group rows to view the full sheet? There is a lot of data and it’s easier to navigate using the grouping feature.
Could you tell how to alter the position of (+) sign – below or above the group of rows, or left or right the group of columns? Grateful in advance
Hi Olegh Bond,
Row grouping is simply hiding/unhiding a group of rows as per your choice.
The only benefit is you can collapse (hide) and expand (unhide) the grouped rows with one click.
Here is the logic.
Here to get the below grouping, you should select the rows 3 and 4 first and group it. Then select the rows 6 and 7 and group it.
Hope this helps.
You can change if the +/- icon should appear above or below by right clicking the icon and choosing the option to move it. The result is mostly only visual, and the grouping will still behave the same.