


")


")

")
")
 in Excel & Google Sheets")


Managing household finances can be stressful — tracking income, expenses, savings, and budgets across months and years often feels overwhelming. That’s why I created a free Household Budget Planner in Google Sheets.
This isn’t just a simple layout. It’s powered by smart formulas that automate calculations and generate an interactive dashboard. All you need to do is enter your income, expenses, and budget plans — and the dashboard will instantly display valuable insights.
With this free Google Sheets budget template, you can:
- Track income and expenses effortlessly
- Monitor planned vs. actual spending
- Visualize your savings percentage and trends over time
- Compare monthly and yearly performance with interactive charts
- See YoY (year-on-year) insights for both months and years
- And much more!
Whether you want a quick overview or a deep dive into your finances, this Household Budget Planner in Google Sheets has you covered. Best of all, it’s completely free to copy and start using right away.
👉 Download the Free Household Budget Planner Template

Template Overview: Household Budget Planner Sheets
Here’s a breakdown of the sheets included in this budget template and what each one does. Understanding these will help you use the planner effectively.
Income Sheet: Track Sources and Dates in Google Sheets
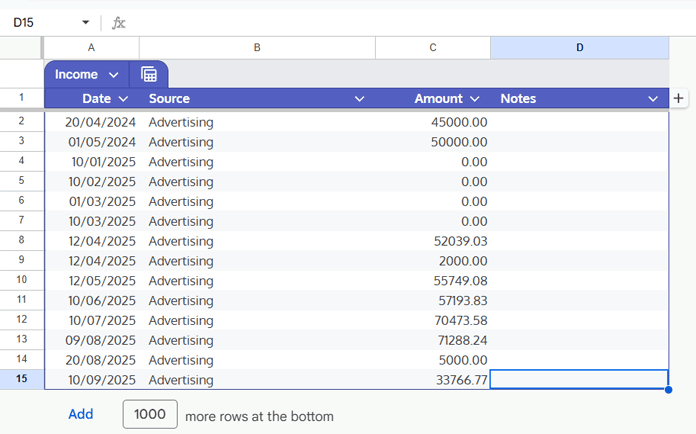
The Income sheet is where you log all the money coming into your household — salary, rent, side hustle payments, or anything else. Keeping it updated ensures the dashboard reflects your real financial picture.
Here’s how to use it:
- Columns → Enter your data in four columns:
- A: Date → when the income was received
- B: Source → where it came from (e.g., Salary, Rent)
- C: Amount → the exact amount received
- D: Notes → optional details you may want to add
- Clean up the sample data → Delete the dummy entries in range A2:D before you start.
- Adding new rows → Simply hover over column A and click the + button to add more records.
- Error-free entry → Since the sheet uses a structured table, you can’t accidentally type text into the Amount or Date columns.
Unlike other tabs, this one has no formulas running in the background, so you can edit it freely without breaking anything. All totals are automatically rolled up into the Annual Overview and Dashboard once you’ve entered your data.
Expense Sheet: Categories, Descriptions, and Payment Modes
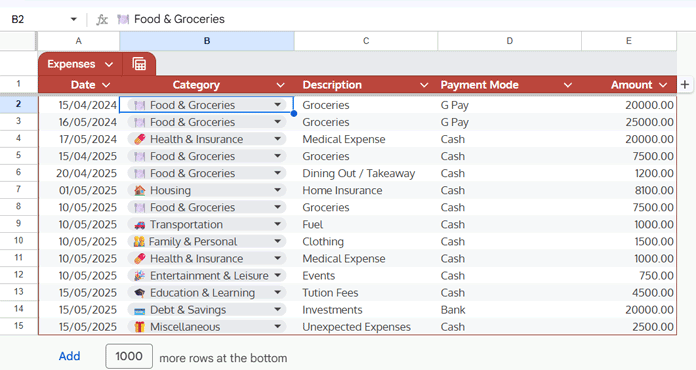
The Expense sheet is where you record all your spending — from groceries to rent, utilities, or even that morning coffee. This sheet is essential because it connects directly to your summary reports and dashboard charts.
Here’s how to use it:
- Columns → Enter your expenses across five columns:
- A: Date → when the expense was made
- B: Category → choose from the drop-down list (e.g., Food & Groceries, Transportation, Miscellaneous)
- C: Description → optional notes for clarity (e.g., “Electricity Bill – September”)
- D: Payment Mode → how you paid (e.g., Cash, GPay, Bank)
- E: Amount → the expense amount
- Categories are preloaded → The options in Column B come directly from the Categories tab (Column A). In that tab, Column B also lists example expenses so you’ll know what belongs where.
- Why consistency matters → Always use the correct category. These feed into your reports and dashboard charts, so staying consistent keeps your insights accurate.
- Error-free entry → Like the Income sheet, this one uses a structured table, so it prevents invalid entries (like typing text into the Amount or Date columns).
Budget Overview: Planned vs Actual Spending
The Budget Overview sheet helps you see how well you’re sticking to your plan by comparing what you intended to spend versus what you actually spent. It’s a simple but powerful way to spot overspending or track savings progress.
Here’s how it works:
- A: Month & Year → already set up with formulas, so no edits needed
- B: Planned Expense → this is the only column you should edit. Enter your monthly planned budget here.
- C: Actual Expense → pulls automatically from the Expense sheet
- D: Difference → shows the gap between your planned and actual spending (calculated for you)
⚠️ Important: Cells A2, C2, and D2 contain array formulas. Don’t overwrite them. Only use Column B to enter your planned expenses.
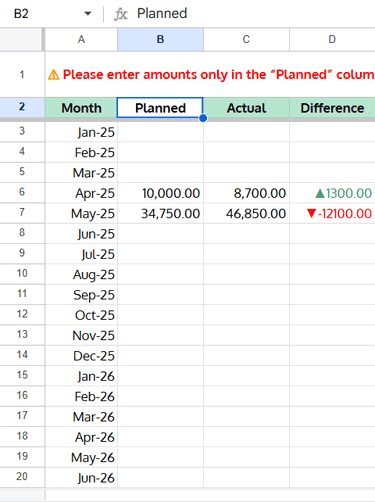
Tip: This sheet isn’t tied to any specific year — it builds a running history of your planned vs actual budgets. The Difference column gives you instant feedback:
- Red = overspending
- Blue = underspending
Annual Overview: Yearly Totals and Comparisons
The Annual Overview sheet is fully automated — no manual entry needed. It pulls data directly from your Income and Expense sheets to give you a high-level snapshot of your household finances.
Here’s what you’ll see:
- Monthly Income → total income for each month
- Monthly Expenses → total expenses for each month
- Net Savings → income minus expenses
- Savings % → percentage of income saved
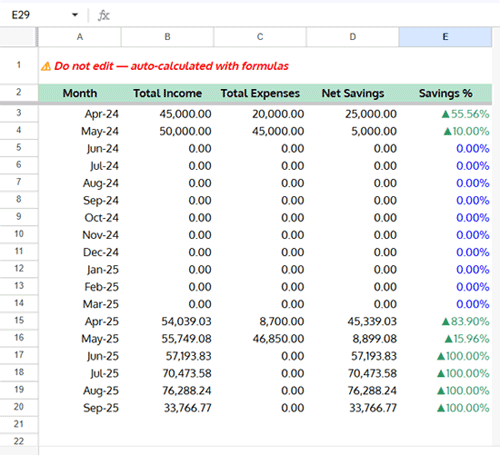
Behind the scenes, the range A2:E2 contains array formulas that keep everything up to date. As soon as you add or update data in the Income or Expense sheets, this tab refreshes automatically.
Tip: Since this sheet tracks month by month, it builds a clear historical view of how your household budget trends over the year.
Helper Tab: Dashboard Support Calculations
The Helper tab is the engine behind the Dashboard. You don’t need to enter any data here — it’s fully automated using smart formulas.
It works by processing the selections from the two dashboard drop-downs:
- C1 → Year
- D1 → Month (Jan–Dec or “All”)
Inside this sheet, four key tables handle all the calculations for the Dashboard:
- Monthly Income, Expenses & Net Savings → pulls and filters data from the Annual Overview based on your selected year and month.
- Expense by Category → summarizes expenses by category from the Expense sheet for the chosen period.
- Budget Overview → extracts planned vs actual expense data dynamically.
- YoY Monthly/Yearly Comparison → calculates income, expenses, and savings % compared to the previous year or month.

Tip: Think of this tab as the “behind-the-scenes calculator” — it keeps your dashboard interactive and accurate without you touching any formulas.
Household Budget Planner Dashboard in Google Sheets
The Dashboard is the heart of your Google Sheets Household Budget Planner — this is where all your data comes to life in interactive charts and reports.
At the top, you’ll find two drop-downs:
- C1 → Year
- D1 → Month / All
⚠️ Tip: Make sure you’ve entered your income, expenses, and planned budget first. Without this data, the charts will appear blank.
Key Metrics at a Glance
The first section gives you an instant overview of your finances:
- 💰 Total Income
- 🛒 Total Expenses
- 📉 Savings
- ✅ Savings %
- 🛒 Planned vs Actual Expenses
A Gauge Chart highlights your Savings %, giving you a quick snapshot of how well you’re saving.
This Year vs Last Year (Dynamic Comparison)
Quickly compare the selected period — whether a specific month or the whole year — with the same period in the previous year:
- 🛒 Expenses
- 📉 Savings
All numbers update automatically based on your drop-down selections.
Visual Insights: Charts and Graphs
Below the key metrics, you’ll find interactive charts that make it easy to analyze your budget:
- Doughnut Charts → show category-wise expense share and planned vs actual expense share
- Column Charts → compare monthly income, expenses, and savings, as well as planned vs actual expenses
All charts respond instantly to your Year and Month / All selections, letting you analyze trends monthly or yearly with ease.
FAQs About the Household Budget Planner
Q1: Can I use this template for multiple years?
Yes! The dashboard has a Year drop-down. You can select any year to view its data, or choose “All” in the Month drop-down to see the full-year summary.
Q2: Do I need to enter data in all sheets?
You should enter data in the Income, Expense, and Budget Overview sheets. The Annual Overview, Helper, and Dashboard tabs are fully automated.
Q3: Can I customize expense categories?
Absolutely. Go to the Categories tab to add or modify categories. The changes will reflect in the Expense sheet drop-down and dashboard charts.
Q4: How is the Savings % calculated?
Savings % is calculated as (Income − Expenses) ÷ Income × 100. Both monthly and yearly savings % are automatically updated in the dashboard.
Q5: Can I create my own version from scratch?
Yes! While this template is ready-to-use, the formulas and structure in the Helper tab and other sheets can guide you if you want to build a custom household budget planner from scratch.
Conclusion: Free Google Sheets Budget Planner
The Free Household Budget Planner in Google Sheets is designed to simplify household finances while giving you powerful insights at a glance.
With smart formulas powering the dashboard, you can:
- Track income and expenses effortlessly
- Monitor planned vs actual spending
- Visualize savings % and trends over time
- Compare monthly or yearly performance
- Access YoY comparisons for a deeper understanding
While this blog explains how to use the template, I’ve published another detailed tutorial on the essential formulas powering the dashboard. It will be especially useful if you want to build your own custom planner or understand how each tab works behind the scenes.
For more free templates and guides, check the homepage.
Your feedback matters! Leave a comment below to share how you’re using this template or suggest improvements.