


Learn in this tutorial about the plugins that can help you to connect Google Analytics to Google Sheets. I have included the steps also.
With the help of complex formulas, you can import your Google Analytics data to Google Sheets. Obviously, it will consume lots of time for importing and then manipulating the data imported.
Then how to quickly connect Google Analytics to Google Sheets and generate dashboards and powerful reports?
Plugins to Connect Google Analytics to Google Sheets
There are two trendy Add-ons to automate the task for you. One is a free plugin called Google Analytics (hereafter I’m calling it Analytics Plugin) and the other is Supermetrics which is coming with a plethora of features.
You can generate powerful analytics out of the box on Google Sheets and supercharge your marketing strategy.
Even without any basic experience in using Google Sheets, you can connect Google Analytics to Google Sheets. As a side note, Google Sheets is free to use.
Both of the above two Google Sheets Add-ons are highly rated in the app store. As the name depicts the former one is purely to connect Google Analytics to Google Sheets but the latter one has other features.
Supermetrics can connect to different data sources like Facebook Insights, MailChimp, SEMrush, etc.
These plugins make use of the advanced data manipulation techniques available in Google Sheets.
Even if you know the use of functions like Query, Index, Date, Time, and Lookup, which are used in data manipulation in Google Sheets, it’s time taking to import ‘proper’ data from external sources to Google Sheets.
Unless you are an expert in using Google Sheets Import functions, you may find it tough to import the required information. The solution is the Add-ons.
Let’s learn how to connect Google Analytics to Google Sheets that can help you to monitor your online marketing strategy.
Here you can find the step-by-step instructions to connect both the Analytic Plugin and Supermetrics to Google Sheets.
How to Connect Google Analytics to Google Sheets
Option 1: Supermetrics
First, let’s see how to Connect this Plugin to Google Sheets.
Steps Involved:
Sign in to Google Sheets and create a new Sheet.
On another tab on your browser, access Supermetrics. You can either try their free version or buy the paid one.
If you are into serious business, I recommend you to use their paid version as the free version has the limitation in the use of the number of Queries and there is no scheduled refreshing.
So your report won’t be auto-updating and completed. The paid version costs $49 (at present) per month.
When you click to install the Add-on, it’ll greet you with a popup.

Click continue and give this Add-on the necessary access to your Google Account. Now you should connect your external data (Google Analytics here).
How to connect Google Analytics to Google Sheets using Supermetrics?

On the Add-ons menu on Google Sheets, find Supermetrics and click Launch. You can now see a new sidebar on your Google Sheets on the right. Click “Data Source” and click Analytics to log in.
There are plenty of other services to choose from. I’m only testing Google Analytics here.

You’re now logged in to Google Analytics and you can now start running queries manually or by using the custom-made templates.
Hope you don’t get scared with the name Query. Actually, you don’t need to do anything. The plugin would take care of every aspect of the report generating. You only need to make a few clicks.
First, let’s see how to create your first Google Analytic report on Google Sheets without using the template feature this Add-on provides.
Then I will explain to you how to access beautiful custom-made Dashboard, Heat-map templates, etc. See the below image. There are several options under “Data Source”

We can use that options to create our first analytic report on Google Sheets manually using this Add-on.
Steps to Create Your First Analytic Report on Google Sheets
1. Select “Select views” and click on the field there and select ” …. All Web Site Data”.
2. Click on “Select dates”. I’m selecting “Today” to generate today’s website traffic report.
Note: You can create numerous reports using Supermetrics that makes this Add-on superior.
You can create custom reports that are not even available in Google Analytics!

3. You can see the “Compare to” option. I’ve set it to “None”. You can use this option to compare certain periods’ metrics with another period.
4. Now click “Select metrics”. Here also there are lots of metrics available like Users, Session, New Users, Bounces, Page Views, etc. Here I’m choosing “Page Views”.
5. The next option is “Select split by”. There are fields for “Split to rows” and “Split to columns”.
In the field “Split to rows” I am selecting “Hour”. The available options are just amazing!
There are options like Year, Nth Minute, Nth Day, Sunday to Monday, Keyword, Referral path, etc. It’s a long list!
6. Time to scroll back to the top of the sidebar and click on the Blue button labeled as “Get data to ….”.
Here instead of importing the data, I’m generating a line chart showing today’s traffic of my website.

It would insert a chart based on the current time. For example, I am running the report on 09:25:00 AM. The generated report contains data of site traffic in each hour starting from 0, 1, 2… to 9 total 10 points.
You can see the data as well as the chart on your sheet. Also, you can refresh the chart.
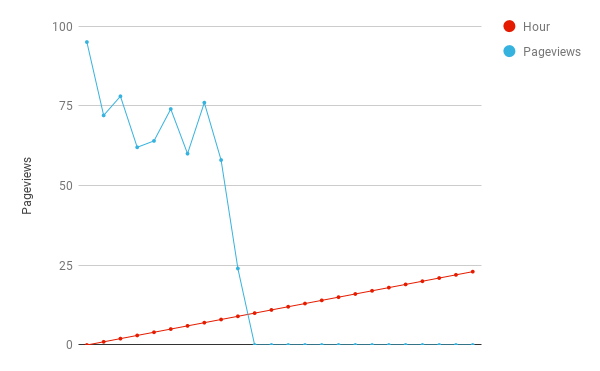
In this chart the red dot on ‘X’ axis indicates hours. The dots on the Blue line chart indicates hourly traffic numbers. This is a basic chart.
In the above under “Select metrics”, you can select “Keyword” to find the keywords for the selected duration.
This way you can create numerous reports and charts in Google Sheets related to your connected Google Analytic Account.
Now let’s see how to use custom-made dashboards and similar templates in Supermetrics.
How to Create a Beautiful and Informative Google Analytics Dashboard on Google Sheets
You have already learned how to connect Google Analytics to Google Sheets using Supermetrics. Time to see how to use the custom templates provided by this Add-on.

Steps:
1. On Google Sheets go to the menu Add-on.
2. Then click Supermetrics > Template Gallery.
3. From the “Pic a template” window scroll down to “GOOGLE ANALYTICS”. Here I’m picking Traffic Dashboard. Click on it to add.
It’ll insert the Analytic Dashboard to your Google Sheet as a new tab with data already filled in from your account!
This Google Sheets Dashboard provides valuable website metrics on a single screen. If you run the report in February, the report will be from your January month data as it outputs the whole month’s data.
The Dashboard report includes Users, Sessions, Bounce rate, New sessions %, Pageviews, Avg. session length, Transactions, Transaction revenue, sparkline charts showing top 20 traffic sources and top landing pages.
There are more templates available for different comparisons.

Option 2: Analytic Plugin
Here is another plugin that you can use to connect Google Analytics to Google Sheets. Let’s see what’s this free Google Analytics Spreadsheet Add-on offers to you!.
Unlike the above premium Google Sheets Add-on which has multiple data connectors, this free plugin can only connect to Google Analytics. Google Analytics is an official Add-on from Google.
First, install this Add-on from the Chrome web store. After successful installation, you can access this from your Add-on menu in Google Sheets.
How to generate reports using Analytic Plugin in Google Sheets?
Steps:
1. In Google Sheets, go to the menu Add-ons > Google Analytics > Create a new report.

2. On the sidebar give any meaningful name to your report. Here I’m giving the name “Info Inspired”.
3. Under “Select a view” select your connected analytic account.
4. Under “Choose configuration options” here I’m selecting “Pageviews” under “Metrics”. There are more options.
5. Under “Dimension” I am selecting “Country”.
6. Then under “Segments”, I am opting for “All Users”. Now click on the blue button labeled as “Create Report”

It would input some content on your sheet. Now in order to get the report, you should do one more thing. Again go to the menu Add-ons > Google Analytics > Run reports.
It will generate a report that covers the country-wise status of your site visitors for the last 30 days. This way you can generate different reports.

Difference Between Supermetrics and Google Analytics
Supermetrics for Google Sheets is a paid service. You have to pay monthly/yearly subscription charges to use. But it’s worth to the money as it can connect to multiple services. On the other hand, the Analytics Plugin is free to use and only for Google Analytics connection.
When you connect Google Analytics to Google Sheets with Supermetrics, you are getting the ultimate marketing tool on your spreadsheet.
It has custom templates that you can set and forget. Reports, charts, everything is built-in or you can download.
You can generate numerous reports using the Analytic plugin too. But to make the best from this plugin, you should know some data manipulation techniques in Google Sheets like the use of Query, Index, and creating Sparklines as well as other Charts.
So that you can create Charts, Dashboards, etc. from the reports. If you want to know how to create a Google Analytics Dashboard using this plugin, here is a video.
That’s all for now. Enjoy.