


Google Sheets offers a plethora of options for data visualization, providing various chart types. The platform intelligently suggests suitable chart types based on your data. In this tutorial, we will focus on creating area charts in Google Sheets, exploring the different variations straightforwardly.
If you’re new to area charts and feel unfamiliar with the process of creating diverse types of area charts, you’ve come to the right place. Here, I’ll guide you through understanding what an area chart is and how to create various area charts in Google Sheets.
Area charts share similarities with line charts, but the key distinction lies in the filled area beneath the line, highlighted with a specific color.
To start, it’s essential to grasp the concept of a line graph. This understanding will facilitate your learning about different area charts in Google Sheets.
Both line charts and area charts serve comparison purposes, much like column or bar charts. However, unlike bar or column charts, an area chart visually represents information that continuously evolves over a short or extended period. In this chart type, the X-axis typically corresponds to time, date, or year.
Steps to Create Area Charts in Google Sheets
There are six distinct types of area charts in Google Sheets, namely:
- Area Chart.
- Stacked Area Chart.
- 100% Stacked Area Chart.
- Stepped Area Chart.
- Stacked Stepped Area Chart.
- 100% Stacked Stepped Area Chart.
To illustrate each of these variations, we will utilize the following sales report spanning 10 years.

How to Insert an Area Chart in Google Sheets?
To insert the area chart, follow the steps below:
- Select the range A1:C12.
- Click on Insert > Chart.
Google Sheets will promptly insert a chart, likely an area chart. If not, choose “Area chart” under the “Chart type” in the sidebar panel/dialog box.
After inserting your desired chart, double-click on the chart to format it if necessary. You can find various customization options under the ‘Customize’ tab within the chart editor.
Now, let’s explore the creation of different types of Area charts and comprehend their applications. You can switch from one area chart to another by selecting your desired type under “Chart type” in the sidebar panel.
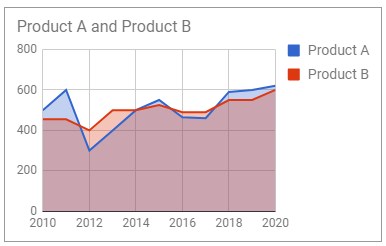
Area Chart
The area chart below illustrates the sales trend of two products, Product A and Product B, spanning 10 years. We utilized the data mentioned above for all the subsequent charts.
Stacked Area Chart
There is a subtle distinction between an area chart and a stacked area chart. It is crucial to grasp this difference before creating stacked area charts in Google Sheets.
When dealing with multiple data series, a stacked area chart becomes relevant. In this type of chart, each data series commences from the point where the preceding series concluded. I will clarify this further.
Referencing our aforementioned data, let’s examine the total sales of Product A and Product B in 2010, which is 500+455=955. Consequently, the second data series will commence from this cumulative point value of 955.
The advantage of a stacked area chart lies in its ability to showcase cumulative sales alongside the data trend.

100% Stacked Area Chart
This represents the percentage contribution of each data series over a specific period in stacked form. Revisiting our sample data above, consider the contribution of Product A and Product B in 2010.
Total sales for Product A and Product B in 2010 = 955.
Percentage contribution for Product A = (500/955) x 100% = 52%.
Percentage contribution for Product B = (455/955) x 100% = 48%.
Now, observe the chart below to visualize the impact.

Stepped Area Chart
The stepped area chart is akin to the standard area chart, with the only distinction being its visual appearance.
It takes on a stepped form, as evident in the chart below. Therefore, I believe no additional explanation is necessary for you to comprehend it.

Stacked Stepped Area Chart
The stepped stacked area chart is akin to the stacked area chart, with the distinction being its stepped form.

100% Stacked Stepped Area Chart
This is similar to the 100% stacked area chart.

Conclusion
The above comprises the six different types of area charts available in Google Sheets. Throughout this tutorial, I trust you found answers to the following chart-related queries:
- How to create area charts in Google Sheets?
- What are area charts in Google Sheets?
- How to create stacked area charts?
- How to create stepped area charts?
- The difference between area charts and line charts?
I trust you found this tutorial informative as I aimed to cover pertinent aspects of area chart creation.
Resources:
- How to Create a Line Chart in Google Sheets
- How to Create a Bar Chart or Bar Graph in Google Sheets
- How to Create Google Sheet Map Geo Chart and Geo Chart with Markers
- How to Create a 3D Pie Chart in Google Sheets – With Pictures
- How to Create Radar Chart in Google Sheets [Step by Step Guide]
- How to Create Column Chart in Google Sheets [Step by Step Guide]
- How to Create a McKinsey Style Waterfall Chart in Google Sheets
- How to Create Site Organisation Chart in Google Sheets
- How to Create a Tree Map Chart in Google Sheets
- How to and Example to Annotated Timeline Chart in Google Sheets
- How to Create Gauge Chart in Google Sheets
- Scatter Chart in Google Sheets and Its Difference with Line Chart
- How to Create a Bubble Chart in Google Sheets
- How to Create a Candlestick Chart in Google Sheets
- Scorecard Charts in Google Sheets – All that You Want to Know
- Pareto Chart in Google Sheets Step-by-Step